Research - (2021) Volume 9, Issue 5
A Comparative Study on Serum Adenosine Deaminase Level in Type 2 Diabetes Mellitus with Renal Failure Patients
D Hemalatha, J Manjula Devi and PR Kalaiselvi*
*Correspondence: PR Kalaiselvi, Department of Biochemistry Sree Balaji Medical College & Hospital Affiliated to Bharath Institute of Higher Education and Research, Chennai, Tamil Nadu, India, Email:
Abstract
Chronic renal failure occurs on the stage in which the kidney is not capable of removing the toxic body fluids and wastes inadequately. Chronic kidney failure is irreversible, and will eventually lead to total kidney failure, also known as end stage renal disease (ESRD). The carbohydrates play an important role in maintaining the kidney’s functions. Glycated hemoglobin (hemoglobin A1c, HbA1c , A1C, or Hb1c )is a form of hemoglobin that is measured primarily to identify the average plasma glucose concentration over prolonged periods of time. The present study was aimed to find the level of Serum Adenosine deaminase (ADA) among the patients with type 2 diabetes mellitus with chronic kidney failure. All the biochemical study parameters were analysed using Statistical Product and Service Solutions (SPSS) 17 software. Statistical tests used were Descriptives, Student t test & Pearson’s Correlation. *P < .05 is significant. **P < .001 is strongly significant. Positive correlation of ADA with chronic kidney failure in D2T patients provided that ADA could be considered for the treatment regime.
Keywords
Adenosine deaminase, Diabetes mellitus type2, Hemoglobin A1c protein human, Blood glucose/metabolism
Introduction
Mutations in the gene for adenosine deaminase cause it not to be expressed. The resulting deficiency is one cause of severe combined immunodeficiency (SCID) [1]. Deficient levels of ADA have also been associated with pulmonary inflammation, thymic cell death, and defective T-cell receptor signaling [2]. Conversely, mutations causing this enzyme to be overexpressed are one cause of hemolytic anemia. There is some evidence that a different allele (ADA2) may lead to autism [3]. Elevated levels of ADA have also been associated with AIDS [1].
ADA2 is the predominant form present in human blood plasma and is increased in many diseases, particularly those associated with the immune system: for example, rheumatoid arthritis, psoriasis, and sarcoidosis. The plasma ADA2 isoform is also increased in most cancers. ADA2 is not ubiquitous but co-exists with ADA1 only in monocytes-macrophages. Total plasma ADA can be measured using high performance liquid chromatography or enzymatic or colorimetric techniques. Perhaps the simplest system is the measurement of the ammonia released from adenosine when broken down to inosine. After incubation of plasma with a buffered solution of adenosine the ammonia is reacted with a Berthelot reagent to form a blue colour which is proportionate to the amount of enzyme activity. To measure ADA2, erythro-9-(2-hydroxy- 3-nonyl) adenine (EHNA) is added prior to incubation to inhibit the enzymatic activity of ADA [1]. It is the absence of ADA1 that causes SCID. ADA can also be used in the workup of lymphocytic pleural effusions or peritoneal ascites, in that such specimens with low ADA levels essentially excludes tuberculosis from consideration [4]. Tuberculosis pleural effusions can now be diagnosed accurately by increased levels of pleural fluid adenosine deaminase, above 40 U per liter [5]. Adenosine deaminase was considered as good marker of cell mediated immunity. Because ADA is associated with T-lymphocyte activity; its altered blood levels may help in predicting immunological dysfunction in diabetic individuals and might be one of the important biomarkers in predicting diabetes mellitus [6].
Chronic kidney disease is defined as a reduced glomerular filtration rate, increased urinary albumin excretion, or both, and is an increasing public health issue. Prevalence is estimated to be 8 –16% worldwide. Complications include increased all -cause and cardiovascular mortality, kidney -disease progression, acute kidney injury, cognitive decline, anaemia, mineral and bone disorders, and fractures [7,8]. Worldwide, diabetes mellitus is the most common cause of chronic kidney disease, but in some region’s other causes, such as herbal and environmental toxins, are more common. The poorest populations are at the highest risk. Screening and intervention can prevent chronic kidney disease, and where management strategies have been implemented the incidence of end - stage kidney disease has been reduced. Awareness of the disorder, however, remains low in many communities and among many physicians. Strategies to reduce burden and costs related to chronic kidney disease need to be included in national programs for non - communicable diseases [9,10].
Carbamylation is a posttranslational modification of proteins resulting from the nonenzymatic reaction between isocyanic acid and specific free functional groups. Thisreaction alters protein structural and f functional properties and thus contributes to molecular ageing Carbamylation is involved in the pathogenesis of other diseases. For example, carbamylation generates new epitopes on _ protein, promoting its self -association into abnormal polymers found in Alzheimer disease [11]. Similarly, carbamylation plays a role in the induction of arthritis by promoting the production of antihomocitrulline autoantibodies and triggering subsequ ent immune responses [12]. This wide range of data leads to the proposal of acommon mechanism of protein carbamylation involvement in pathophysiological processes: although carbamylation never constitutes the sole initial causative factor of a disease, it first is a consequence of the process, and then11 becomes an aggravating factor by promoting the development of long -term complications Several CDPs have been suggested as biomarkers to evaluate the rate of protein carbamylation in biological samples, especially in plasma and whole blood . Two approaches can be used to assess the extent of protein carbamylation: the quantification of a specific carbamylated protein, and the overall assessment of carbamylated plasma proteins. The first approach involves the assay of 2 carbamylated proteins: carbamylated hemoglobin (cHb) and cLDL. cHb mainly results from the covalent binding of isocyanic acid to the N -terminal valine residue of the globin _ chains [13] and can reach 2% of total hemoglobin. cHb was initially identified as an analytical interference in the measurement of Hb A1c by ion -exchange chromatography. cHb also constitute s a ―pathophysiological interference‖ during Hb A1c formation, because isocyanic acid competes with glucose for the binding to the N - terminal valine residue. The implication is that Hb A1c values obtained in uremic patients should be carefully interpreted [14,15]. cHb is generally assayed by liquid chromatography coupled to ultraviolet detection of the hydantoin derivative of N -carbamylvaline obtained during acid hydrolysis [16]. The concentrations of cHb, expressed as microgram of valine hydantoin (VH) per g ram of total hemoglobin (_gVH/gHb), range between 27 and 38 _gVH/gHb in healthy individuals, and are about 5 times higher in patients with CRF the increase in cHb correlates with both the duration and the degree of exposure to high blood urea concentrations [17] suggesting that cHb could be a useful biomarker in differentiating patients with acute or chronic renal failure [18,19].
Materials and Methods
The study was conducted in a sample of 80 Type 2 diabetic patients reported to diabetic outpatient department and 40 healthy non-diabetic individuals who came for routine check - up at Sree Balaji Medical College & Hospital between December 2014 and May 2015. The inclusion criteria are diabetes patients with chronic renal failure of both sexes (20 – 70 years of age) and diabetic patient without chronic renal failure of both sexes (20 – 70 years of age) and exclusion criteria are those with advanced malignancy and those who not regular follow up.Group I included 40 normal healthy individuals both males and females in the age group of 30 - 60 years from the general population who volunteered for getting included in the present study. Group II and III comprised of 30 patients with oral hypoglycaemic drugs with HbA1c<7 % (30 -60 years). Group III - comprised of 30 patients of Type 2 Diabetes Mellitus including both male and female in the age group of 30 -60 years on oral hypoglycaemic drugs with HbA1c>7 %. The research and ethical committee of the university approved the study protocol. All participants were provided with written informed consent before enrolment in the study. Age, gender, height, weight, DM duration, general history and medications were recorded. Blood samples were collected following overnight fasting.
Results and Discussion
Of these 80 Diabetic individuals, one half were in group II belonging to have the HbA1C level <7 and the other half were in group III belonging to have HbA1C > 7.
All the biochemical study parameters were analysed using Statistical Product and Service Solutions (SPSS) 17 software. Statistical tests used were Descriptives, Student t test & Pearson’s Correlation. *P < .05 is significant. **P < .001 is strongly significant (Tables 1-4).
Table 1: Descriptive statistics for group I.
| Age | Sex | FBS | PPBS | HbA1C | ADA | ||
|---|---|---|---|---|---|---|---|
| N | Valid | 42 | 41 | 43 | 42 | 39 | 31 |
| Missing | 0 | 0 | 0 | 0 | 0 | 0 | |
| Mean | 42 | 89 | 139 | 5 | 37.8 | ||
| Std. Deviation | 3.567 | 9.888 | 6.999 | 0.753 | 4.572 | ||
Table 2: Descriptive statistics for group II.
| Age | Sex | FBS | PPBS | HbA1C | ADA | ||
|---|---|---|---|---|---|---|---|
| N | Valid | 30 | 30 | 30 | 30 | 30 | 30 |
| Missing | 0 | 0 | 0 | 0 | 0 | 0 | |
| Mean | 53.567 | 113.894 | 150.567 | 7.456 | 49.895 | ||
| Std. Deviation | 10.567 | 3.999 | 7.123 | 0.4932 | 3.1234 | ||
Table 3: Descriptive statistics for group III.
| Age | Sex | FBS | PPBS | HbA1C | ADA | ||
|---|---|---|---|---|---|---|---|
| N | Valid | 41 | 41 | 41 | 41 | 41 | 41 |
| Missing | 0 | 0 | 0 | 0 | 0 | 0 | |
| Mean | 49.879 | 145.68 | 191.67 | 9.732 | 56.999 | ||
| Std. Deviation | 9.76 | 10.56 | 10.56 | 1.786 | 3.213 | ||
Table 4A: Comparison of FBS between group I & II independent samples test.
| t-Test for equality of means | |||||||
|---|---|---|---|---|---|---|---|
| T | df | Sig. (2-tailed) | Mean Difference | Std. Error Difference | 95% Confidence Interval of the Difference | ||
| FBS I & II | -0.79 | 25 | 0.9111 | -0.387 | 4.986 | -7.9996 | 7.9754 |
Table 4B: Comparison of FBS between group II & III: Independent samples test.
| t- Test for equality of means | |||||||
|---|---|---|---|---|---|---|---|
| t | df | Sig. (2-tailed) | Mean Difference | Std. Error Difference | 95% Confidence Interval of the Difference | ||
| fbs3 | -0.298 | 27 | 0.6789 | -1.495 | 4.9034 | -10.998 | 7.997 |
Table 4C: Comparison of FBS between group I & III: independent samples test.
| t- test for equality of means | |||||||
|---|---|---|---|---|---|---|---|
| t | df | Sig. (2-tailed) | Mean Difference | Std. Error Difference | 95% Confidence Interval of the Difference | ||
| FBS I & III | 1.98 | 27 | 0.34 | 9.999 | 3.999 | 1.1678 | 16.987 |
Tables 4A to Tables 4C and Figure 1 the values are expressed in Mean ± SD. Student t test (two tailed) has been used to find the significance. The FBS values in group I, group II, group III are 1.98, 27, 0.34, 9.999, 3.999, 1.1678 and 16.987, respectively. The levels in diabetics are higher than healthy controls and the difference is strongly significant (P<0.02).
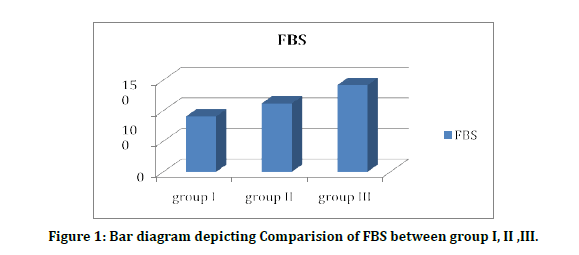
Figure 1: Bar diagram depicting Comparision of FBS between group I, II ,III.
Table 5A to 5C and figure 2 showed the comparison of PPBS and t test is done to estimate its significance. The PPBS values in group I, group II, group III were varied and statistically significant, respectively. The levels in diabetics are higher than healthy controls and the difference is strongly significant (P<0.04).
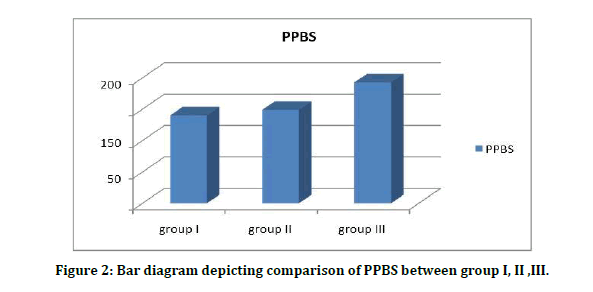
Figure 2: Bar diagram depicting comparison of PPBS between group I, II ,III.
Table 5A: Comparison of PPBS between group I & II: Independent samples test.
| t- test for equality of means | |||||||
|---|---|---|---|---|---|---|---|
| T | Df | Sig. (2-tailed) | Mean Difference | Std. Error Difference | 95% Confidence Interval of the Difference | ||
| PPBS I | -0.029 | 29 | 0.985 | -0.07999 | 2.5342 | -5.2222 | 5.10896 |
Table 5B: Comparison of PPBS between group II & III: Independent samples test.
| t- test for equality of means | |||||||
|---|---|---|---|---|---|---|---|
| T | Df | Sig. (2-tailed) | Mean Difference | Std. Error Difference | 95% Confidence Interval of the Difference | ||
| PPBS3 | -0.356 | 26 | 0.6932 | -1.5789 | 4.12345 | -9.999 | 7.675 |
Table 5C: Comparison of PPBS between group I & III: Independent samples test.
| t- test for Equality of Means | ||||||
|---|---|---|---|---|---|---|
| t | Df | Sig. (2-tailed) | Mean Difference | Std. Error Difference | 95% Confidence Interval of the Difference | |
| 0.832 | 26 | 0.399 | 3.1243 | 5.234 | -3.999 | 10.9123 |
Serum HbA1C levels among patients Diabetes Mellitus without CKD 7.8 ± 1.0 (%) were significantly higher than Diabetes Mellitus with CKD 5.4 ± 0.65(%) with level of significance as (t value=13.50) (p=0.001) (Tables 6A to 6C).
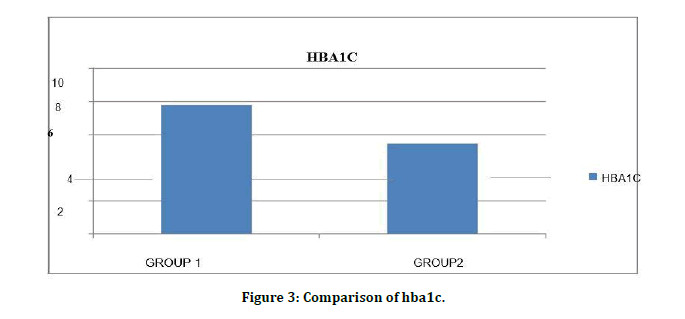
Figure 3: Comparison of hba1c.
Table 6A: Comparison of HbA1C between group I & II: Independent samples test.
| t- test for equality of means | |||||||
|---|---|---|---|---|---|---|---|
| t | df | Sig. (2-tailed) | Mean Difference | Std. Error Difference | 95% Confidence Interval of the Difference | ||
| hba1c1 | 0.286 | 27 | 0.815 | 0.07121 | 0.2987 | -0.4543 | 0.61234 |
Table 6B: Comparison of HbA1C between group II & III: Independent samples test.
| t- test for equality of means | |||||||
|---|---|---|---|---|---|---|---|
| t | df | Sig. (2-tailed) | Mean Difference | Std. Error Difference | 95% Confidence Interval of the Difference | ||
| hba1c3 | -0.657 | 27 | 0.6453 | -0.3452 | 0.5673 | -1.2134 | 0.6111 |
Table 6C: Comparison of HbA1C between group I & III: Independent samples test.
| t- test for equality of means | |||||||
|---|---|---|---|---|---|---|---|
| t | df | Sig. (2-tailed) | Mean Difference | Std. Error Difference | 95% Confidence Interval of the Difference | ||
| hba1c3 | 1.987 | 28 | 0.99 | 0.6999 | 0.4999 | -0.12987 | 1.6999 |
Serum urea levels among patients Diabetes Mellitus without CKD 26.12 ± 9.95 mg/dl were significantly lower than Diabetes Mellitus with CKD99.11 ± 38.98 mg/dl with level of significance as (t value=11.983) (p=0.10) (Figure 4).
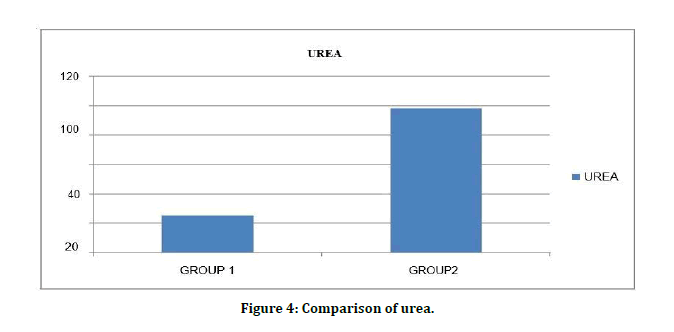
Figure 4: Comparison of urea.
Serum creatinine levels among patients Diabetes Mellitus without CKD 0.82 ± 0.26mg/dl were significantly lower than Diabetes Mellitus with CKD 4.0 ± 2.9mg/dl with level of significance as (t value=7.63) (p=0.001) (Figure 5). Comparison of FBS is shown in Figure 6.
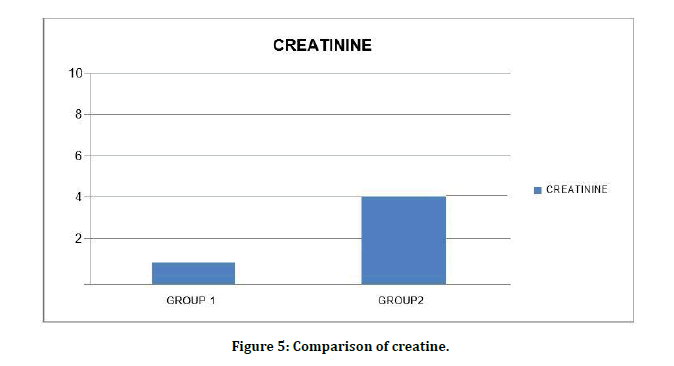
Figure 5: Comparison of creatine.
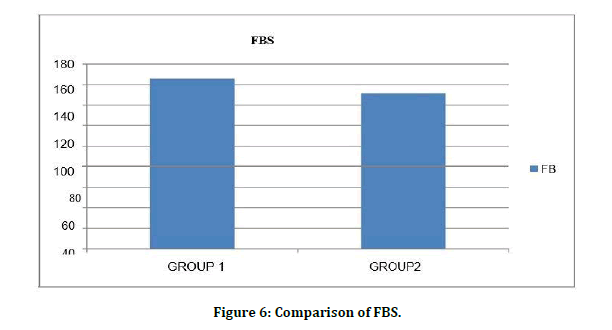
Figure 6: Comparison of FBS.
Table 7A to 7C and Figure 7 shows ADA values in group I, group II, group III are 35 ± 4.5, 48 ± 2.97 and 57.3 ± 3.34 respectively. Student t test (two tailed) has been used to find the significance. The levels in diabetics are higher than healthy controls and the difference is strongly significant (P<0.05).
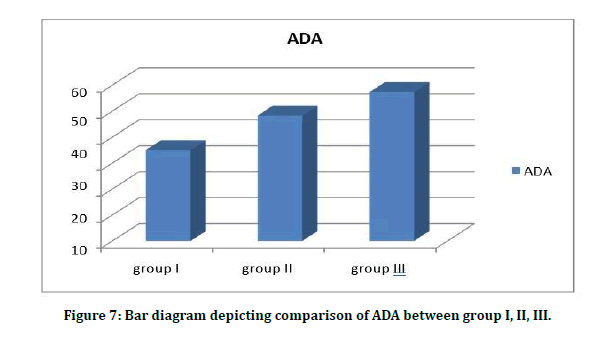
Figure 7: Bar diagram depicting comparison of ADA between group I, II, III.
Table 7A: Comparison of ADA between group I & II: Independent samples test.
| t- test for equality of means | |||||||
|---|---|---|---|---|---|---|---|
| t | df | Sig. (2-tailed) | Mean difference | Std. error difference | 95% Confidence interval of the difference | ||
| ada1 | -0.445 | 28 | 0.66 | -0.77512 | 1.74063 | -4.34065 | 2.79041 |
Table 7B: Comparison of ADA between group II & III: Independent samples test.
| t- test for Equality of Means | |||||||
|---|---|---|---|---|---|---|---|
| t | df | Sig. (2-tailed) | Mean Difference | Std. Error Difference | 95% Confidence Interval of the Difference | ||
| ada3 | -1.467 | 28 | 0.153 | -1.82297 | 1.24251 | -4.36813 | 0.72219 |
Table 7C: Comparison of ADA between group I & III: Independent samples test.
| t- test for equality of means | |||||||
|---|---|---|---|---|---|---|---|
| t | df | Sig. (2-tailed) | Mean Difference | Std. Error Difference | 95% Confidence Interval of the Difference | ||
| ada3 | 1.309 | 28 | 0.235 | 1.61111 | 1.23123 | -0.91095 | 4.13317 |
Serum FBS levels among patients Diabetes Mellitus without CKD 169.67 ± 17.91mg/dl ere significantly higher than Diabetes Mellitus with CKD 153.39 ± 12.99 mg/dl with level of significance as (t value=4.59) (p=0.001). Chronic renal failure develops in many diabetic patients. The role of glycemic control and the value of HbA1c in diabetic subjects with renal disease are controversial. While interference from carbamylated Hb can be evaluated, the role of renal anemia, erythropoietin intake, and other factors in chronic renal failure is more difficult to evaluate. Re-measuring carbamylated hemoglobin after in vitro glycation showed lower levels compared to those obtained from RBCs samples incubated only with the same urea concentrations. This indicated that in presence of a fixed level of urea, carbamylated hemoglobin decreases with increase glucose concentration which can be explained by that glycation of some hemoglobin free amino groups prevents their participation in carbamylation reaction. This result agreed with a previous report which demonstrated that carbamylated hemoglobin was significantly lower in diabetic patients and provided further evidence of decrease carbamylation in samples with abnormally high glucose concentrations through in vitro carbamylation experiment using a fixed urea concentration of 70 mg/dl.
Conclusion
It is not surprising that the measured HbA1c is elevated in presence of high urea concentration when the former is measured by a method depending on the positive charges on nonaltered hemoglobin. We were expecting an attenuation of this elevation at high glucose and urea concentrations due to interference of the two reactions: glycation and carbamylation involving the same amino groups.
Funding
No funding sources.
Ethical Approval
The study was approved by the Institutional Ethics Committee.
Conflict of Interest
The authors declare no conflict of interest.
Acknowledgements
The encouragement and support from Bharath Institute of Higher Education and Research, Chennai is gratefully acknowledged. For provided the laboratory facilities to carry out the research work.
References
- Sanchez JJ, Monaghan G, Børsting C, et al. Carrier frequency of a nonsense mutation in the adenosine deaminase (ADA) gene implies a high incidence of ADA-deficient severe combined immunodeficiency (SCID) in Somalia and a single, common haplotype indicates common ancestry. Ann Hum Genet 2007; 71:336–347.
- Cowan MJ, Brady RO, Widder KJ . Elevated erythrocyte adenosine deaminase activity in patients with acquired immunodeficiency syndrome. Proceedings of the National Academy of Sciences of the United States of America 1986; 83:1089–1091.
- Persico AM, Militerni R, Bravaccio C, et al. Adenosine deaminase alleles and autistic disorder: case-control and family-based association studies. Am J Med Genet 2000; 96:784–90.
- Jiménez Castro D, Díaz Nuevo G, Pérez-Rodríguez E, et al. Diagnostic value of adenosine deaminase in nontuberculous lymphocytic pleural effusions. Eur Respir J 2003; 21:220–224.
- Brunicardi F, Andersen D, Billiar T, et al. Chapter 18, question 16. Schwartz's principles of surgery (8th Edn) 2005.
- Ogbu ISI, Nebo NC, Onyeanusi JC. Adenosine deaminase activities andfasting blood glucose in obesity. J College Med 2006; 11:115-119.
- Plantinga LC, Tuot DS, Powe, NR. Awareness of chronic kidney disease among patients and providers. Adv Chronic Kidney Dis 2010; 17:225-236.
- Tonelli M, Wiebe N, Culleton B, et al. Chronic kidney disease and mortality risk: a systematic review. J Am Soc Nephrol 2006; 17:2034–2047.
- Heidenheim AP, Kooistra MP, Lindsay RM. Quality of life. Contrib Nephrol 2004; 145: 99–105.
- Pierratos A, McFarlane P, Chan CT. Quotidian dialysis –update 2005. Curr Opin Nephrol Hypertens 2005; 14:119–124.
- Mydel P, Wang Z, Brisslert M, et al. Carbamylation dependent activation of T cells: A novel mechanism in the pathogenesis of autoimmune arthritis. J Immunol 2010; 184:6882–6990.
- Fluckiger R, Harmon W, Meier W, et al. Hemoglobin carbamylation in uremia. N Engl J Med 1981; 304:823–827.
- Chachou A, Randoux C, Millart H, et al. Influence of in vivo hemoglobin carbamylation on HbA1c measurements by various methods. Clin Chem Lab Med 2000; 38:321–326.
- Szymezak J, Lavalard E, Martin M, et al. Carbamylated hemoglobin remains a critical issue in HbA1c measurements. Clin Chem Lab Med 2009; 47:612–3.
- Kwan JT, Carr EC, Bending MR, et al. Determination of carbamylated hemoglobin by high performance liquid chromatography. Clin Chem 1990; 36:607–610.
- Stim J, Shaykh M, Anwar F, et al. Factors determining hemoglobin carbamylation in renal failure. Kidney Int 1995; 48:1605–610.
- Sacks DB, Bruns DE, Goldstein DE, et al. Guidelines and recommendations for laboratory analysis in the diagnosis and management of diabetes mellitus. Clin Chem 2002; 48:436-472.
- Davenport A, Jones SR, Goel S, et al. Differentiation of acute from chronic renal impairment by detection of carbamylated haemoglobin. Lancet 1993; 341:1614–617.
- Wynckel A, Randoux C, Millart H, et al. Kinetics of carbamylated haemoglobin in acute renal failure. Nephrol Dial Transplant 2000; 15:1183–1188.
Author Info
D Hemalatha, J Manjula Devi and PR Kalaiselvi*
Department of Biochemistry Sree Balaji Medical College & Hospital Affiliated to Bharath Institute of Higher Education and Research, Chennai, Tamil Nadu, IndiaCitation: D Hemalatha, J Manjula Devi, PR Kalaiselvi, A Comparative Study on Serum Adenosine Deaminase Level in Type 2 Diabetes Mellitus with Renal Failure Patients, J Res Med Dent Sci, 2021, 9 (5):200-206.
Received: 04-Apr-2021 Accepted: 19-May-2021 Published: 31-May-2021
