Research - (2023) Volume 11, Issue 2
A Hematological and Physiological Study of Diabetes Mellitus Male Patients
Noor alhuda Ghanem Al-Fatlawi*, Zahraa Mohammed Fakheir Al_Nafakh, Samah Amer Hammood and Sabreen Ghanem Al-Fatlawi
*Correspondence: Noor alhuda Ghanem Al-Fatlawi, Department of Science, University of Kufa, Iraq, Email:
Abstract
Objective: Over 25 million Americans and an estimated 285 million individuals worldwide suffer with diabetes mellitus, which is linked to a heavy burden of problems. This study's goal was to assess how fasting blood glucose interacted with leukocyte counts, platelet counts, blood pressure, and body mass index. Methods: This study involved a control group of 40 individuals who appeared to be in good health and 180 male diabetic patients (70 type 1 and 70 type 2) who were randomly chosen from the diabetes mellitus center in Al-Sadder Teaching City in the province of Al-Najaf in Iraq. The age range of the control and patient groups was 35 to 65 years. Results: The results revealed a significant difference (P>0.05) in WBCs and platelet count in both type 1 and type 2 patients when compared with control groups, but a significant rise (P>0.05) in FBG in both type 1 and type 2 patients. The findings also demonstrated a significant rise in BMI and blood pressure (DBP & SBP) (P<0.05) in both type 1 and type 2 patients in comparison to the control groups, as well as a significant difference in DBP and SBP (P<0.05) between patients and control groups at various ages. Conclusion: Diabetes mellitus has been linked to higher BMIs than normal weight, and the majority of patients are obese. One of the causes of high blood pressure is DM. Patients with type 1 and type 2 diabetes do not significantly differ in their WBC and platelet counts from the control group.
Keywords
Diabetes mellitus, Fasting blood glucose, White blood cells, Blood pressure, Body mass index
Introduction
Diabetes mellitus, also referred to as diabetes, is a collection of metabolic illnesses defined by persistently elevated blood sugar levels (hyperglycemia), which are highly related with cardiovascular disease [1]. Hyperglycemia caused by deficiencies in insulin secretion, insulin action, or both characterizes diabetes mellitus [2].
The immune system's leukocytes are responsible for protecting the body from both infectious diseases and external objects. All parts of the body, including the blood and lymphatic system, include leukocytes [3]. Leukocyte counts in the blood are frequently used as illness indicators. In the United States, inflammation is most frequently to blame for this increase in leukocytes activated by advanced glycation end products [4], oxidative stress, and angiotensin II [5] in a state of hyperglycemia [6].
Small enucleate discoid cell fragments known as platelets are released by megakaryocytes in the bone marrow. Patients with diabetes mellitus have platelets with dysregulated signaling pathways, which increases their propensity to activate and aggregate in response to a specific stimulus (platelet hyper reactivity) [7].
BP, or blood pressure Every regular clinical care visit should include a blood pressure check [8] Patients with diabetes frequently have hypertension, with frequency varying based on characteristics such the type and length of diabetes, age, sex, race/ethnicity, BMI, history of glycemic control, and the presence of kidney disease [9,10].
Materials and Methods
Patients and healthy groups: 80 participants who were enrolled in the study at the Center for Diabetes Mellitus and Endocrinology at Al-Sader Medical City were split into three groups based on their clinical examination and medical history: I patients with type 1 diabetes (n=70); (ii) patients with type 2 diabetes (n=70); and (iii) non-diabetic subjects (control; n=40). Doctors on staff made the diagnosis of diabetes mellitus. The name, age, weight, and height of the patients were collected by a questionnaire. The age range of the controls and patients.
Measurements
Measurements of serum glucose: A glucose (GOD-PAP) kit was used to measure the level of serum glucose (Biolabo SA, France).
Body Mass Index (BMI) The following equation was used to compute body mass index values: (m2). It was measured using a height and electrical balancing device. The BMI levels for healthy weight are 18.5-24.9 kg/m2 and 25-29.9 kg/m2 for overweight people. A person is obese when their BMI is greater than 30 kg/ m2 [11]. Blood pressure: Following a 30-minute period of rest, blood pressure was checked using a Mercury sphygmomanometer. White Blood Cells and Platelets count: using Hematology analyzer/cbc analyser.
Statistical analysis
On the home computer, data analysis was done using SPSS (Version 17). The results were presented in terms of mean and standard error. The measured parameters were compared between the patient and control groups using a paired t-test. To measure the correlation between factors, correlation coefficients were determined. The figures were created using the EXEL tool of Microsoft Office 2007 and the Graph Pad Prism 5 program. The statistically significant level was set at a P-value of 0.05 or below [12].
Results
According to the results of (Figures 1 and 2), type 1 and type 2 diabetic patients' fasting blood glucose (FBG) levels significantly increased (P 0.05) when compared to the healthy control group's level of 97.942.27 mg/dl. Additionally, the data demonstrate a significantly higher BMI (P 0.05) in type 1 and type 2 diabetic patients as compared to the healthy control group, which had a BMI of 22.11 0.81 kg/m2. Normal weight 12 percent (n=11), overweight 32 percent (n=19), and obese 56 percent (n=50) were the percentages of BMI groups in type 1 diabetes, while normal weight 5 percent (n=4), overweight 9 percent (n=7), and obese 100 percent (n=86) were the percentages in type 2 diabetes Figures 3 to Figure 6. Shows no significant difference (P>0.05) in white blood cells concentration between diabetic (type 1 and type 2 ) and control groups they were (7.671 ± 0.4607 X 10⁹/l and 7.402 ± 0.4008 X 10⁹/l in diabetic type 1 and type 2 respectively) and 7.244 ± 0.2409 X 10⁹/l in control groups, also Figures 7 to Figure 10, shows no significant difference (P>0.05) in platelet concentration between diabetic(type 1 and type 2 ) and control groups they were (273.6 ± 23.83 X 10⁹/l and 233.8 ± 13.13 X 10⁹/l in diabetic type 1 and type 2 respectively) and 262.4 ± 16.76 X 10⁹/l in control groups. The results of the blood pressure show a significant difference (P0.05) in diastolic blood pressure in (type 1 and type 2 diabetic patients) (821.2mmHg, 81.332.58mmHg respectively) when compared with healthy control group 79.710.90mmHg, while the results of the systolic blood pressure show a significant increase (P<0.05) in (type 1 and type 2 diabetic patients) (133.0 ± 2.843 mmHg, 134.0 ± 3.055 mmHg respectively) in comparing with healthy control group 121.9 ± 1.08 mmHg Tables 1 to Table 3. In comparison to control groups at various ages, the data shown in Tables 4 and Table 5 show no statistically significant difference (P>0.05) in W.B.C. and P.L.T. for the patient groups. Tables 6 and 7. Demonstrate significant(P<0.05) differences in DBP and SBP between patient groups at various ages and control groups There is no significant link (P>0.05) between FBG level and BMI, WBC count, PLT count, DBP, or SBP in type 1 D.M patients, according to the results of correlation and linear regression between FBG and other parameters.
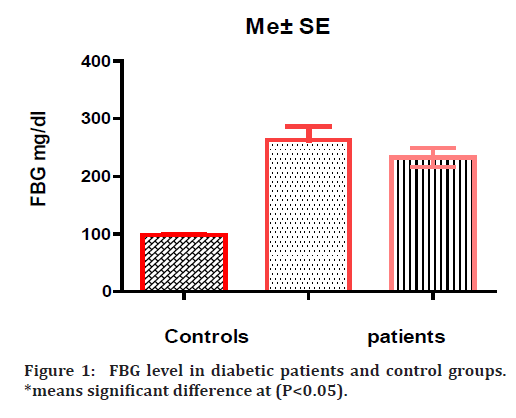
Figure 1. FBG level in diabetic patients and control groups. *means significant difference at (P<0.05).
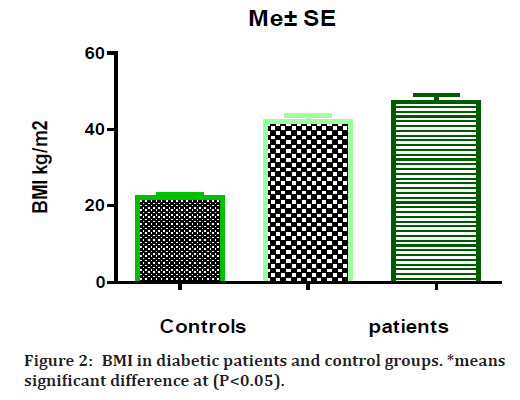
Figure 2. BMI in diabetic patients and control groups. *means significant difference at (P<0.05).
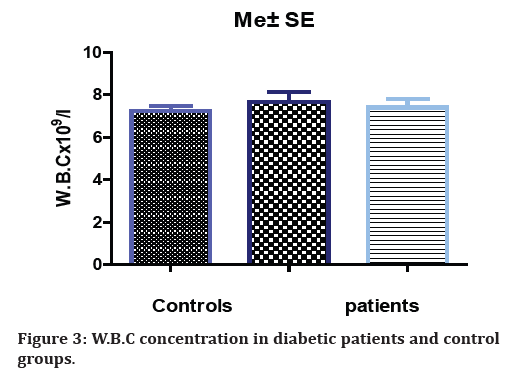
Figure 3. W.B.C concentration in diabetic patients and control groups.
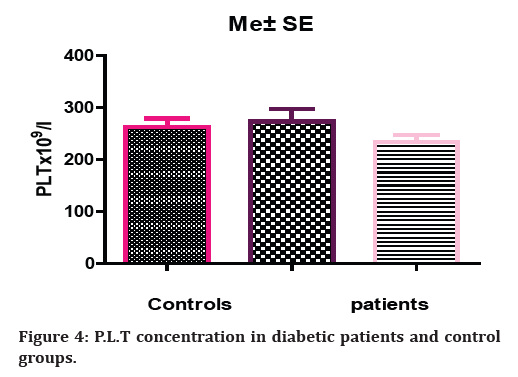
Figure 4. P.L.T concentration in diabetic patients and control groups.
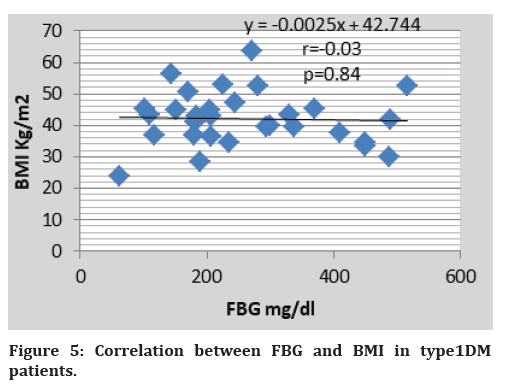
Figure 5. Correlation between FBG and BMI in type1DM patients.
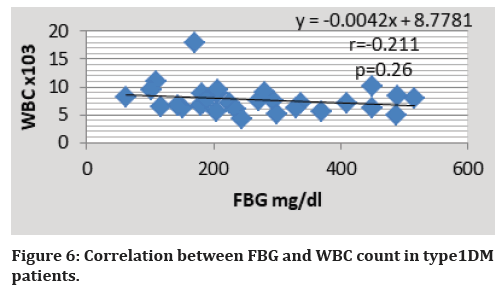
Figure 6. Correlation between FBG and WBC count in type1DM patients.
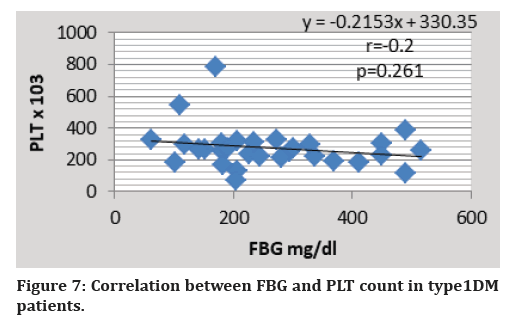
Figure 7. Correlation between FBG and PLT count in type1DM
patients.
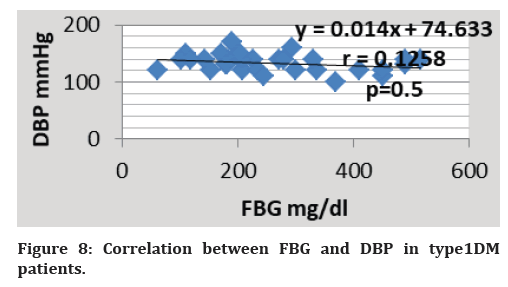
Figure 8. Correlation between FBG and DBP in type1DM patients.
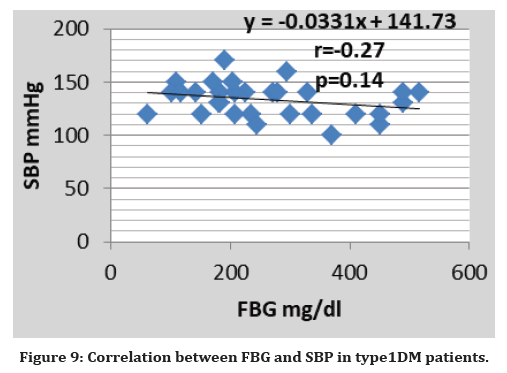
Figure 9. Correlation between FBG and SBP in type1DM patients.
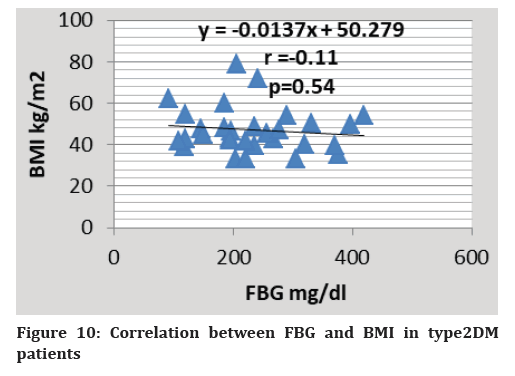
Figure 10. Correlation between FBG and BMI in type2DM patients
| BMI groups | No. | Percent’s |
|---|---|---|
| Normal weight | 11 | 0.12 |
| Over weight | 19 | 0.32 |
| Obese | 50 | 0.56 |
Table 1: BMI groups in type 1 DM patients.
| BMI groups | No. | Percent’s |
|---|---|---|
| Normal weight | 4 | 0.05 |
| Over weight | 7 | 0.09 |
| Obese | 69 | 0.86 |
Table 2: BMI groups in type 2 DM patients.
| Groups/ Blood pressure | Me ± SE | Patients n=140 | |
|---|---|---|---|
| Control n=40 | Type 1 n=70 | Type 2 n=70 | |
| Diastolic B.P.(mmHg) | 79.71 ± 0.90 | 82 ± 1.2* | 81.33 ± 2.58* |
| Systolic B.P.(mmHg) | 121.9 ± 1.080 | 134.0 ± 3.055* | 133.0 ± 2.843 * |
| *means significant difference at (P<0.05) | |||
Table 3: Blood pressure (Diastolic & Systolic) in patients and control groups.
| Criteria Age (year) | W.B.C count X 109/l | ||
|---|---|---|---|
| Controls N=40 | Patient n=140 | ||
| Type1 n=70 | Type 2 n=70 | ||
| 35-45y | 6.881 ± 0.31 | 6.396 ± 0.36 | 6.383 ± 0.61 |
| 46-55y | 7.482 ± 0.5 | 8.058 ± 0.41 | 7.381 ± 0.36 |
| 56-65y | 8.06 ± 0.19 | 9.986 ± 2.25 | 7.739 ± 0.79 |
Table 4: W.B.C count of patients and control groups in different age stage
| Criteria Age (year) | P.L.T count X 109/l | ||
|---|---|---|---|
| Controls N=40 | Patient n=140 | ||
| Type1 n=70 | Type 2 n=70 | ||
| 35-45y | 277 ± 28.02 | 243.8 ± 20.39 | 236.8 ± 23.89 |
| 46-55y | 248 ± 17.75 | 243.3 ± 29.47 | 242.3 ± 26.51 |
| 56-65y | 248.7 ± 31.22 | 440.6 ± 104 | 233.8 ± 17.25 |
Table 5: P.L.T count of patients and control groups in different age stage
Also The following are the findings of the correlation and linear regression between FBG and other parameters in patients with type 2 diabetes mellitus: The relationship between FBG level and (BMI, WBC count, PLT count, DBP and SBP) is not statistically significant (P>0.05) (Figures 10-14).
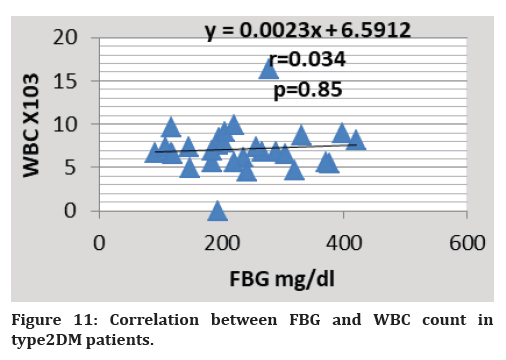
Figure 11. Correlation between FBG and WBC count in type2DM patients.
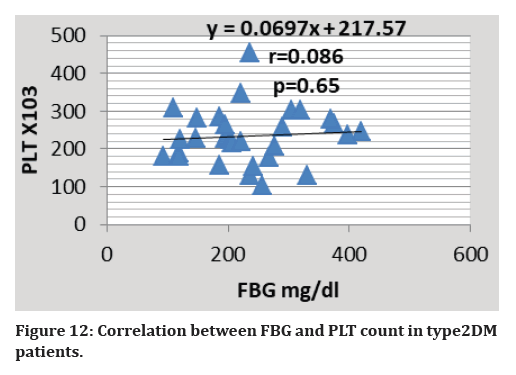
Figure 12. Correlation between FBG and PLT count in type2DM patients.
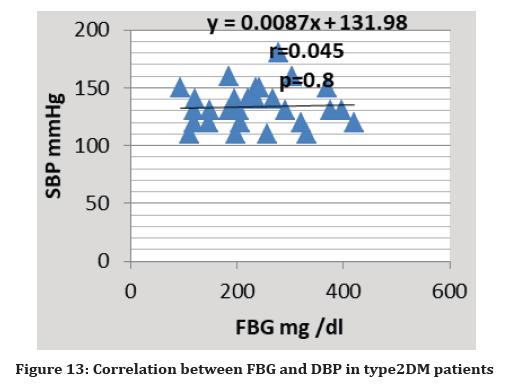
Figure 13. Correlation between FBG and DBP in type2DM patients
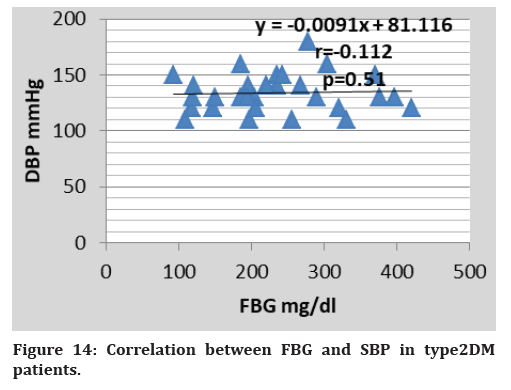
Figure 14. Correlation between FBG and SBP in type2DM patients.
Discussion
According to the study, type 1 and type 2 diabetic patients had significantly higher fasting blood glucose levels than the control group. Given that hyperglycemia is the primary defining trait of DM, these findings are predicted. Two crucial processes strictly regulate blood glucose: - the production of insulin by pancreatic beta cells in response to a nutrient and the impact of insulin on the body's main target organs, such as skeletal muscle, the liver, and adipose tissue [13].
According to the findings, patients with type 1 and type 2 diabetes have significantly higher BMIs than control groups. These results support the results achieved by [14], they show a good relationship between BMI and DM. In other words, people who are obese are more likely to develop diabetes. The literature backed up the current result that diabetes and other chronic diseases are greatly increased by obesity [15-17]. About 55 percent of type 2 diabetics are reportedly fat [18]. Because adipose tissue is a source of various chemical signals to other tissues, chronic obesity causes increased insulin resistance that can evolve into diabetes. Before the onset of chronic hyperglycemia, obesity exhibits insulin resistance [19]. Even in obese people with normoglycemia and diabetic patients, obesity is usually linked to insulin resistance [20].
The results indicate that there is no discernible difference between type 1 and type 2 patients' total WBC counts when compared to controls, but we did find some elevation in some type 1 and type 2 DM patients. Despite this, all means of total WBCs were high and close to the upper limit of the normal WBC count this may be due to the association between inflammation response and diabetes observed, as WBCs are one measure of inflammation. This result is consistent with recent research that showed that young workers with low and high WBC counts had an increased chance of developing diabetes [21]. The findings indicate that there is no appreciable variation in the total platelet count between type 1 and type 2 patients and the control group. This finding is corroborated by another study, which also found no appreciable changes in platelet count in diabetes patients. [22]. According to the study, type 1 and type 2 patients had significantly higher diastolic and systolic blood pressure when compared to the control group (3). Hypertension, which is regarded as a major cause of morbidity and mortality in adults, is thought to be one of the most prevalent disorders afflicting humans. Heart disease, stroke, and even renal failure are the main side effects of hypertension [23]. Since many years ago, it has been recognized that one of the causes of hypertension is diabetes mellitus. Both those with insulin-dependent diabetes (IDDM) and those with non-insulin-dependent diabetes (NIDDM) have shown signs of having high blood pressure [24]. Tables 6 and 7 demonstrate significant differences in DBP and SBP between patient groups at various ages and control groups (P 0.05). The alterations in the reninangiotension- aldosterone system, catecholamines, renal disorders, arteriosclerosis, hyperglycemia, and hyperinsulinaemia are some of the pathophysiological pathways that contribute to hypertension in diabetic patients, independent of age [25]. This occurs at the risk of intracellular dehydration because increased glucose levels in the extracellular fluid compartment increase osmotic pressure, which in turn causes fluid to move from the intracellular to extracellular compartment. Due to its ability to increase renal tubular salt absorption, which is linked to water retention, hyperinsulinaemia may also result in hypervolemia [26]. Thus, volume expansion over an extended period of time in patients with poorly controlled diabetes mellitus may result in higher cardiac output and consequently hypertension. Diabetic patients have diffuse glomerulosclerosis, which is linked to hypertension [27] Additionally, changes in the reninangiotension- aldosterone system have been noted, and certain patients have significantly lower plasma levels of renin and angiotension, which predisposes the patients to developing hypertension [28].
| Criteria Age (year) | DBP mmHg | ||
|---|---|---|---|
| Controls N=40 | Patient n=140 | ||
| Type1 n=70 | Type 2 n=70 | ||
| 35-45y | 70.50 ± 0.5 | 73.33 ± 6.072 | 77.50 ± 2.5* |
| 46-55y | 80.00 ± 3.742 | 83.33 ± 2.108 | 82.09 ± 0.9* |
| 56-65y | 80.33 ± 3.33 | 82 ± 2 | 83.57 ± 2.31* |
Table 6: Diastolic Blood pressure of patients and control groups in different age stage
| Criteria Age (year) | SBP mmHg | ||
|---|---|---|---|
| Controls | Patient n=140 | ||
| N=40 | Type1 n=70 | Type 2 n=70 | |
| 35-45y | 119.5 ± 0.5 | 130± 5.5* | 130 ± 5.77* |
| 46-55y | 126.0 ± 2.44 | 140 ± 5.16* | 128.2 ± 3.77* |
| 56-65y | 123.3 ± 3.33 | 140 ± 4.47* | 138.6 ± 5.33* |
| *means significant difference at (P<0.05) | |||
Table 7: Systolic Blood pressure of patients and control groups in different age stage.
Conclusion
Diabetes mellitus has been linked to higher BMIs than normal weight, and the majority of patients are obese. One of the causes of high blood pressure is DM. Patients with type 1 and type 2 diabetes do not significantly differ in their WBC and platelet counts from the control group.
References
- Centers for Disease Control and Prevention. National diabetes fact sheet: National estimates and general information on diabetes and prediabetes in the United States, 2011. Atlanta, GA: US department of health and human services, centers for disease control and prevention. 2011; 201:2568-9.
- https://accessmedicine.mhmedical.com/content.aspx?bookid=380§ionid=39744039
- Anthea M, Hopkins J. Wright. Human Biology and Health. Englewood Cliffs, New Jersey, USA: Prentice Hall.
- Hassan AB, AL-Msaid HL, Noori ghani Al-dujaili A, et al. Measurement of lipid profile in fasting persons. Medico-Legal Update 2020; 20:209.
- Lee FT, Cao Z, Long DM, et al. Interactions between angiotensin II and NF-κB–dependent pathways in modulating macrophage infiltration in experimental diabetic nephropathy. J Am Soc Nephrol 2004; 15:2139-2151.
- Kumar V, Abbas AK, Fausto N, et al. Robbins and Cotran pathologic basis of disease, professional edition e-book. Elsevier health sciences; 2014.
- Geraldo RB, Sathler PC, Lourenço AL, et al. Platelets: Still a therapeutical target for homeostatic disorders. Int J Mol Sci 2014; 15:17901-19.
- Drawz PE, Ix JH. BP measurement in clinical practice: Time to SPRINT to guideline-recommended protocols. J Am Soc Nephrol 2018; 29:383-388.
- De Ferranti SD, De Boer IH, Fonseca V, et al. Type 1 diabetes mellitus and cardiovascular disease: A scientific statement from the American Heart Association and American Diabetes Association. Circulation 2014; 130:1110-30.
- Arauz-Pacheco C, Parrott MA, Raskin P. Treatment of hypertension in adults with diabetes. Diabetes Care 2003; 26:80-82.
- Guyton AC, Hall JE. Textbook of medical physiology. Philadelphia: Saunders 1986.
- Al-Rawi K. Entrance to the Statistics. Second edition. Faculty of Agriculture and Forestry, University of Mosul, 2000.
- Vital P, Larrieta E, Hiriart M. Sexual dimorphism in insulin sensitivity and susceptibility to develop diabetes in rats. J End 2006; 190:425-432.
- Adham M, Froelicher ES, Batieha A, et al. Glycaemic control and its associated factors in type 2 diabetic patients in Amman, Jordan. East. Mediterr. Health J 2010; 16:732-739.
- El-Hazmi MA, Warsy AS, Al-Swailem AR, et al. Diabetes mellitus and IGT in relation to gender and age in Najran, Saudi Arabia. Bahrain Med Bulletin 1997; 19:40-44.
- Marshall SM, Flyvbjerg A. Prevention and early detection of vascular complications of diabetes. BMJ 2006; 333:475-80.
- Yassin MM, Altibi HI, El Shanti AE. Clinical and biochemical features of type 2 diabetic patients in Gaza Governorate, Gaza Strip. West Afr J Med 2011; 30:51-6.
- Centers for Disease Control and Prevention (CDC). Prevalence of overweight and obesity among adults with diagnosed diabetes--United States, 1988-1994 and 1999-2002. MMWR. Morbidity and mortality weekly report 2004; 53:1066-8.
- Daniel M, Marion SA, Sheps SB, et al. Variation by body mass index and age in waist-to-hip ratio associations with glycemic status in an aboriginal population at risk for type 2 diabetes in British Columbia, Canada. Am J Clin Nutr 1999; 69:455-60.
- Evans JL, Goldfine ID, Maddux BA, Grodsky GM. Oxidative stress and stress-activated signaling pathways: a unifying hypothesis of type 2 diabetes. Endocrine reviews. 2002; 23:599-622.
- Du X , Zhu B, Hu G, et al. U‐shape association between white blood cell count and the risk of diabetes in young Chinese adults. Diabetic medicine 2009; 26:955-60.
- Ogbodo SO, Chukwurah EF, Okoro IL, et al. Platelet number and functions in diabetic patients in Enugu, Nigeria. Pharmacologyonline 2007; 2:300-306.
- khalfa HM, al-msaid HL, Abood AH, et al. Cellular genetic expression of purinergic receptors in different organs of male rats injected with cyclophosphoamide. In AIP Conference Proceedings 2020; 2290:020033.
- Al-Msaid HL, Al-Sallami AS. Study the level of cytokine in unexplained and idiopathic infertile men. J Pharm Sci Res 2018; 10:808-11.
- DeFronzo RA. Insulin resistance: A multifaceted syndrome responsible for NIDDM, obesity, hypertension, dyslipidaemia and atherosclerosis. Neth J Med 1997; 50:191-7.
- Christlieb, AR, Krolewski, AS, Warram JH, et al. In Insulin the link between hypertension and obesity?. Hypertension 1985; 7:54-57.
- Gellman DD, Pirani CL, Soothill JF, et al. Diabetic nephropathy: A clinical and pathologic study based on renal biopsies. Medicine 1959; 38:321-368.
- Christlieb AR. Nephropathy, renin system, and hypertensive vascular-disease in diabetes-mellitus. Cardio Med 1978; 3:417.
Indexed at, Google Scholar, Cross Ref
Indexed at, Google Scholar, Cross Ref
Indexed at, Google Scholar, Cross Ref
Indexed at, Google Scholar, Cross Ref
Indexed at, Google Scholar, Cross Ref
Indexed at, Google Scholar, Cross Ref
Indexed at, Google Scholar, Cross Ref
Indexed at, Google Scholar, Cross Ref
Indexed at, Google Scholar, Cross Ref
Indexed at, Google Scholar, Cross Ref
Indexed at, Google Scholar, Cross Ref
Indexed at, Google Scholar, Cross Ref
Indexed at, Google Scholar, Cross Ref
Indexed at, Google Scholar, Cross Ref
Indexed at, Google Scholar, Cross Ref
Indexed at, Google Scholar, Cross Ref
Author Info
Noor alhuda Ghanem Al-Fatlawi*, Zahraa Mohammed Fakheir Al_Nafakh, Samah Amer Hammood and Sabreen Ghanem Al-Fatlawi
Department of Science, University of Kufa, IraqCitation: Noor alhuda Ghanem Al-Fatlawi, Zahraa Mohammed Fakheir Al_Nafakh, Samah Amer Hammood, Sabreen Ghanem Al-Fatlawi, A Hematological and Physiological Study of Diabetes Mellitus Male Patients, J Res Med Dent Sci, 2022, 11(2):21-28.
Received: 05-Jan-2023, Manuscript No. jrmds-22-79701; Accepted: 07-Jan-2023, Pre QC No. jrmds-22-79701; Editor assigned: 07-Jan-2023, Pre QC No. jrmds-22-79701; Reviewed: 21-Jan-2023, QC No. jrmds-22-79701; Revised: 27-Jan-2023, Manuscript No. jrmds-22-79701; Published: 06-Feb-2023
