Research - (2020) Advances in Dental Surgery
Awareness About Risk Factors and Complications in Artificial Organ Transplantation: A Survey Based Analysis
Obuli Ganesh Kishore S1, Keerthi Sasanka2*, Jothi Priya A3 and Dhanraj Ganapathy2
*Correspondence: Keerthi Sasanka, Department of Prosthodontics, Saveetha Dental College and Hospital, Saveetha Institute of Medical and Technical Sciences, Saveetha University Tamilnadu, Chennai, India, Email:
Abstract
Artificial organs are manmade organ devices that are implanted in human living tissue to replace a natural organ when there is a necessity to perform a specific function. The main aim of this study was to assess the awareness about the risk factors and complications in artificial organ transplants among college students. A self-structured questionnaire was circulated among college students through online google forms link. The responses were collected, and the results were statistically analysed in SPSS software. The results were represented in the form of pie charts and graphs. Results and conclusion: Majority of the survey population are aware that there are artificial organs engineered. They also think artificial organs can be as effective as natural organs and they may also have some side effects. Hence the awareness and knowledge about artificial organs is assessed. This survey may bring out changes in the field of organ transplants in the future.
Keywords
Artificial organs, Risks, Complications, Transplants
Introduction
Organ transplantation can be defined as the medical procedure in which a donor donates an organ, and it is placed in the body of a recipient, when there is any requirement to replace a damaged or diseased organ [1]. Organ donation can be defined as the process in which a person allows an organ of his/her own to be removed and transplanted to another person legally [2,3]. The donor can be a person who is alive or dead. The most common organs that are being transplanted worldwide are kidneys, liver and heart [4]. The tissues can also be transplanted [5]. The tissue transplants commonly include cornea, bones and muscles [6]. There is a great demand for organ donors worldwide [7]. There can be transplant rejection due to the immune system responses of the recipient [8]. The immune system starts to destroy the transplanted organ or tissue [9]. It can be minimised by determining molecular similarities between donor and recipient or using immunosuppressive drugs after transplantations. But an organ transplant is not always successful [10]. The advancements in recent technology has led to the invention of artificial organs [11]. The artificial organs are devices that are implanted in the humans to coordinate and conduct or perform various functions of the body along with the other organs [12].
Solid organ transplants have progressed rapidly by advancements in immunosuppressants, imaging methods, antimicrobial agents, and donor recipient matching [13]. Not always any organ transplant has a lifetime success rate when that is the main purpose [14]. A viable artificial organ would greatly improve the current treatment for end to stage cardiac disease, more patients would benefit from this treatment [15]. There can be so many ethical issues in the case of artificial organs, they are said to have very less life expectancy and are quite expensive [16]. A study shows that there are very less organ donors compared to the number of recipients [17]. Hence it is impossible to treat many sick patients [18]. In that case a mechanical organ can come into action to provide a solution for organ transplantation [19].
Since there is no complete usage of mechanical devices, the comparison of pros and cons of them is difficult [20]. This study can be used to create awareness about artificial organs among people and to welcome the technology to save lives of people. The aim of this study is to assess the awareness and knowledge about risk factors and complications involved in artificial organ transplantation.
Materials and Methods
A cross sectional survey-based analysis was conducted among college students online. The survey population included 100 participants. A self-structured questionnaire containing 15 questions including the demographic data were circulated online through a google forms link. The questions were close ended, and validation was done by the members of the institution. The collected responses were statistically analysed in SPSS software. The analysed results were depicted in the form of pie charts and graphs. From a survey conducted by Devi et al. the survey population included 99 students, it was conducted to assess the awareness of organ donation among young adults [21]. Another survey conducted by Tamuli et al. consisted of 360 students to assess the attitude and awareness of organ donation among UG and PG students [22].
Results and Discussion
The results were collected, and the data was analysed. Most of the population were aware that there were artificial organs engineered. Almost half of the population think artificial organs are more effective than natural ones and believe that there could be some risks and complications associated with artificial organ transplants.
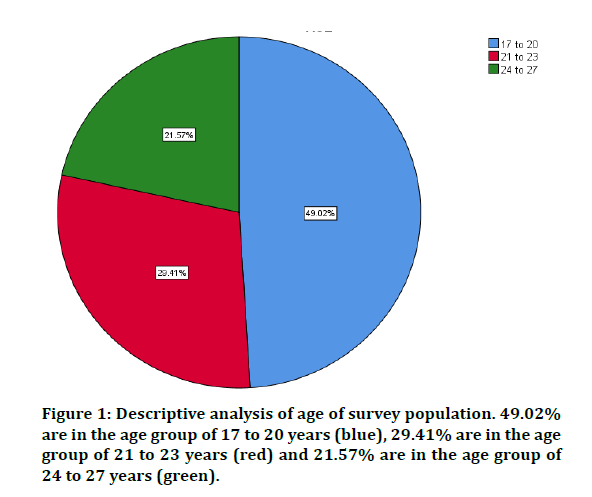
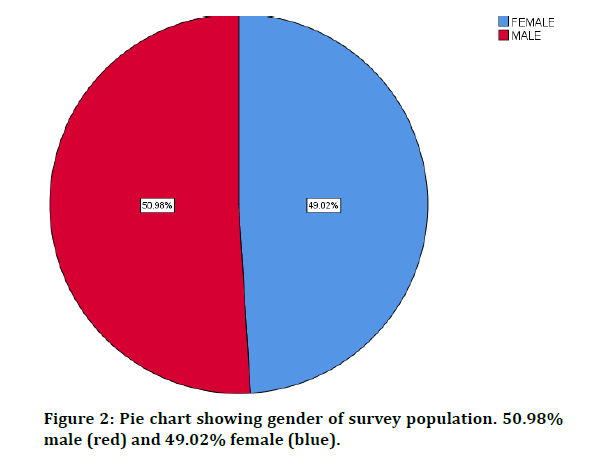
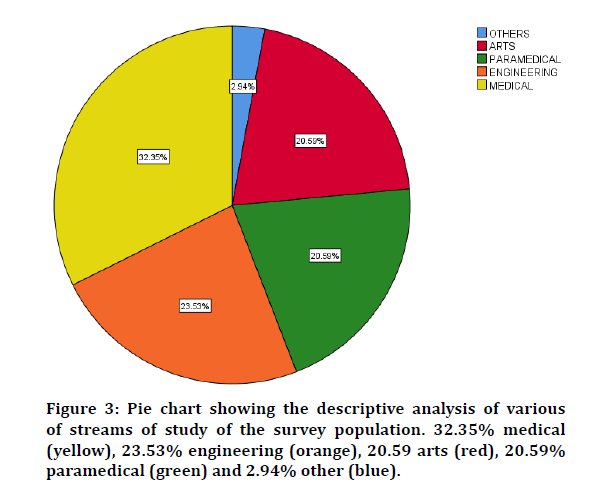
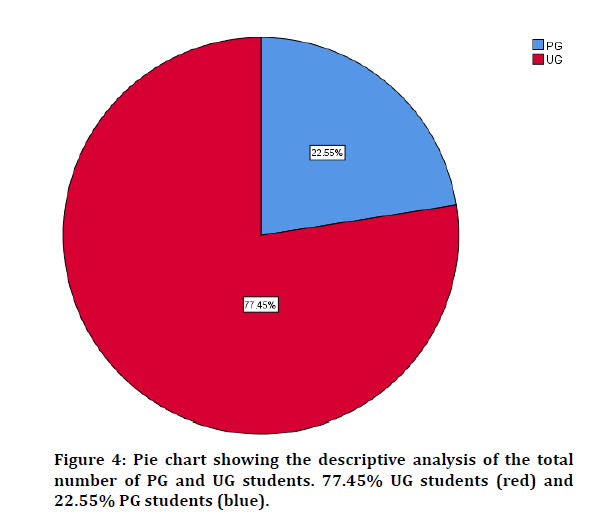
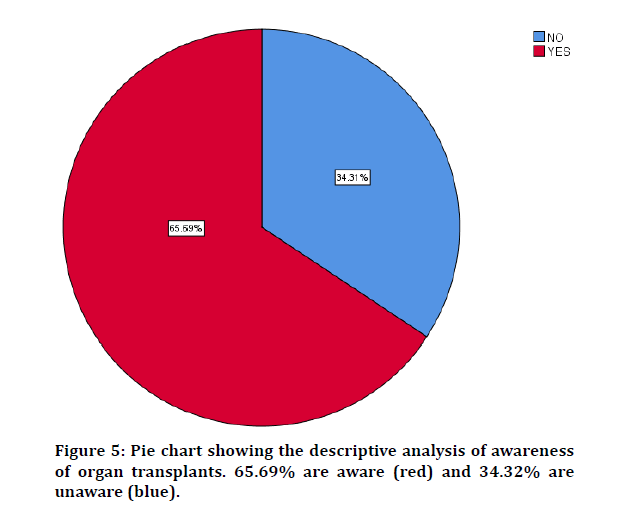
Figure 1: Age-The age group of the survey population included 7.84% of the students who belonged to the group aging 18 years, 16.67% who were 21 years old and 9.8% who were 23 years old. Apart from these age groups, students belonged to other ages but in insignificant percentages. Figure 2: Gender- 50.98% of the population were males and 49.02% of the population were females. In a survey conducted by Sam et al. the survey population included 37.7% males and 62.3% [23]. Figure 3: Area of study- 32.35% of the population were medical students, 23.53% of the students were engineering students and 20.59% were arts students. The rest of the population consisted of students belonging to other streams. Figure 4: 77.45% of the population consisted of undergraduate students and 22.55% consisted of postgraduate students. Figure 5: Awareness- 65.69% of the participants aware of organ transplant while 34.31% of the students were unaware of this. According to a survey conducted by Tamuli, et al. 79.17% were aware of organ transplant and 4.16% were completely unaware [22].
Figure 1: Descriptive analysis of age of survey population. 49.02% are in the age group of 17 to 20 years (blue), 29.41% are in the age group of 21 to 23 years (red) and 21.57% are in the age group of 24 to 27 years (green).
Figure 2: Pie chart showing gender of survey population. 50.98% male (red) and 49.02% female (blue).
Figure 3: Pie chart showing the descriptive analysis of various of streams of study of the survey population. 32.35% medical (yellow), 23.53% engineering (orange), 20.59 arts (red), 20.59% paramedical (green) and 2.94% other (blue).
Figure 4: Pie chart showing the descriptive analysis of the total number of PG and UG students. 77.45% UG students (red) and 22.55% PG students (blue).
Figure 5: Pie chart showing the descriptive analysis of awareness of organ transplants. 65.69% are aware (red) and 34.32% are unaware (blue).
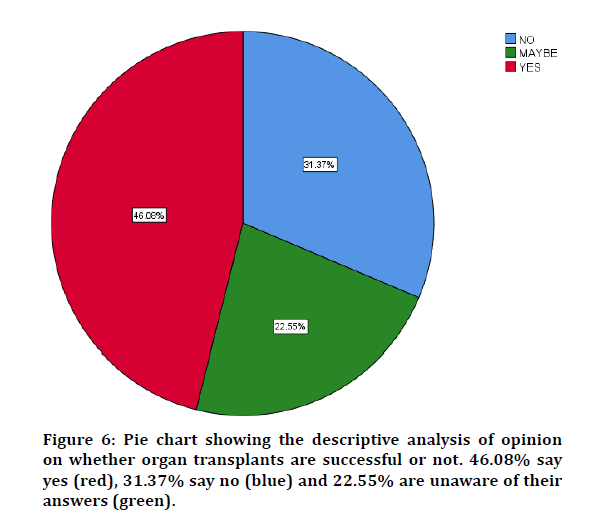
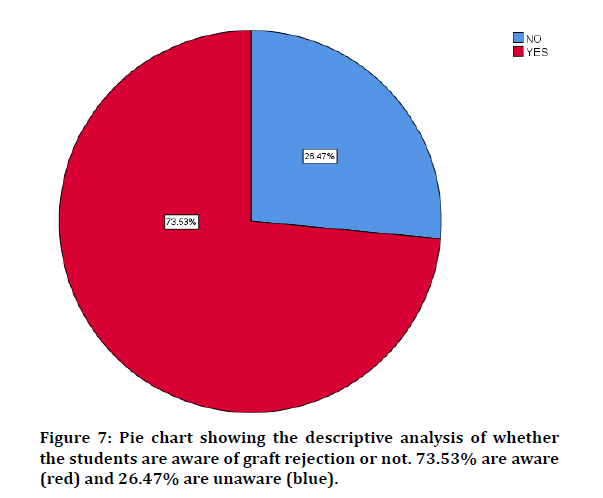
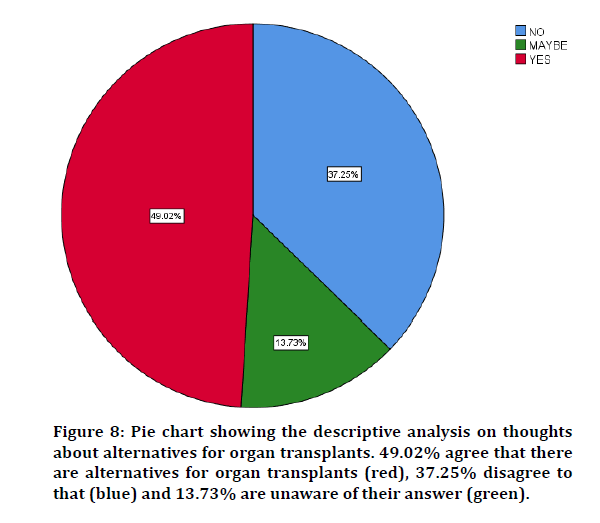
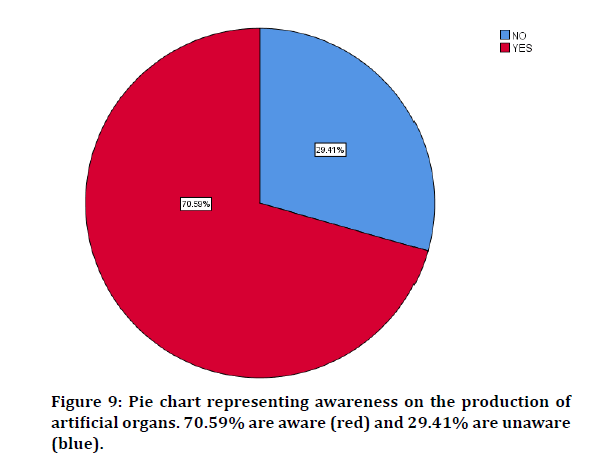
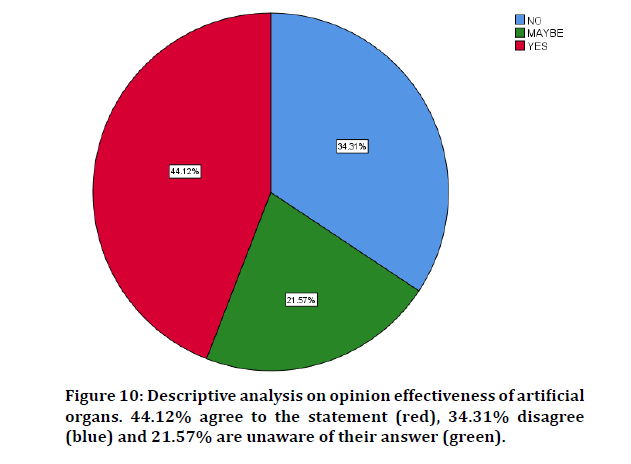
Figure 6: Attitude- 46.08% of the participants believed that organ transplants are effective and have a long-term life expectancy but 31.37% of the students disagreed to this, the rest 22.55% are unaware of their answer. According to a survey conducted by Saleem et al. 56.8% agreed to promote organ donation and 43.2% disagreed to the same [24]. Figure 7: Knowledge- 73.53% of the population were aware of graft rejection and 26.47% were unaware of this term. According to a survey conducted by Sam et al. only 49.4% of the students were aware of the risks and complications associated with organ transplant [23]. Figure 8: 49.02% of the total population were aware that there were alternatives to organ transplants and 37.25% were unaware of the same. The rest 13.73% of the population did not possess any idea about this. Figure 9: 70.59% of the students were aware that there were artificial organs that were being engineered and 29.41% of them remained unaware. Figure 10: Knowledge- 44.12% of the students believe that artificial organs could be as effective as natural ones while 34.3q% of the population disagree to this statement and the remaining 21.57% do not possess any idea on the same. According to a survey conducted by Oluyombo et al. only 19.4% of the population think that organ transplant in most cases is effective [25].
Figure 6: Pie chart showing the descriptive analysis of opinion on whether organ transplants are successful or not. 46.08% say yes (red), 31.37% say no (blue) and 22.55% are unaware of their answers (green).
Figure 7: Pie chart showing the descriptive analysis of whether the students are aware of graft rejection or not. 73.53% are aware (red) and 26.47% are unaware (blue).
Figure 8: Pie chart showing the descriptive analysis on thoughts about alternatives for organ transplants. 49.02% agree that there are alternatives for organ transplants (red), 37.25% disagree to that (blue) and 13.73% are unaware of their answer (green).
Figure 9: Pie chart representing awareness on the production of artificial organs. 70.59% are aware (red) and 29.41% are unaware (blue).
Figure 10: Descriptive analysis on opinion effectiveness of artificial organs. 44.12% agree to the statement (red), 34.31% disagree (blue) and 21.57% are unaware of their answer (green).
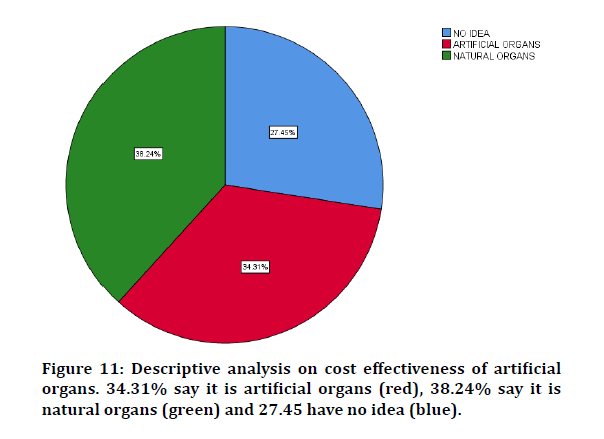
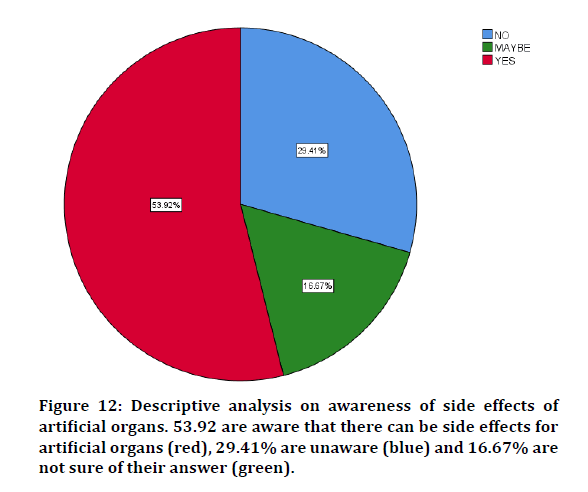
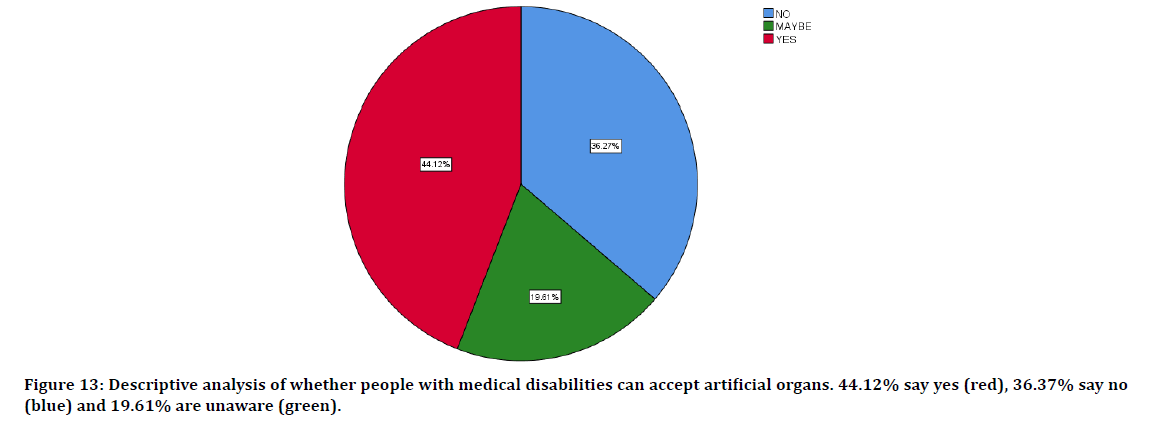
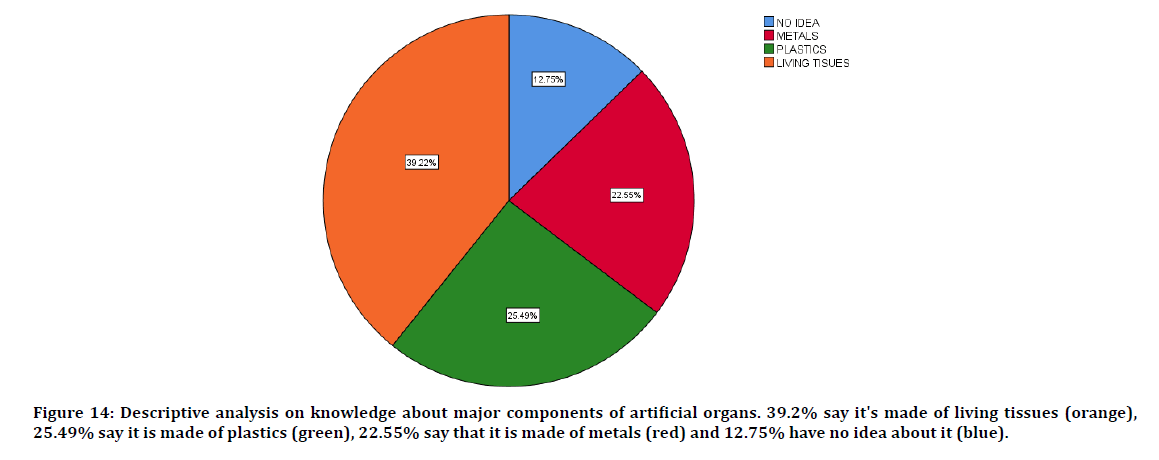
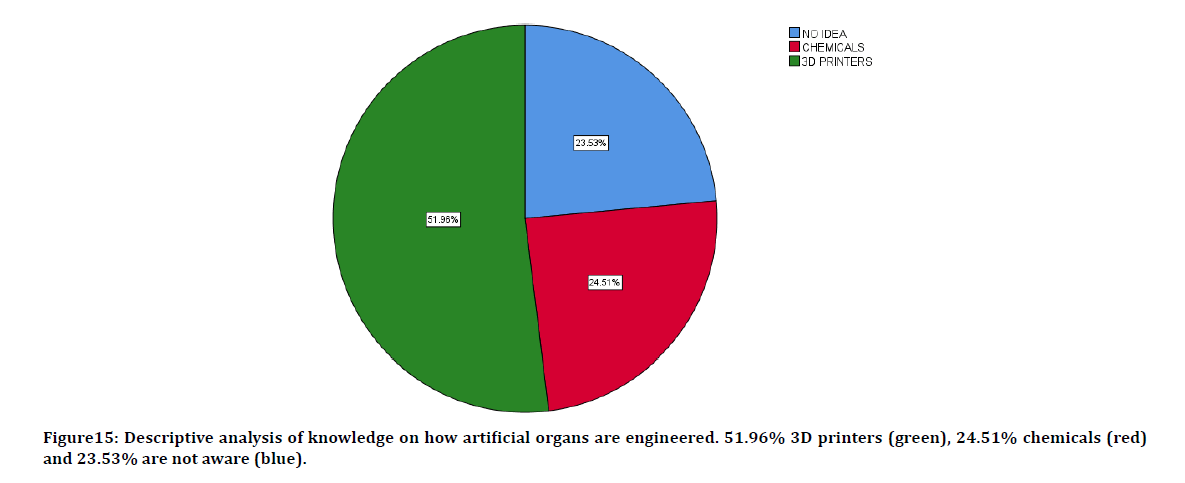
Figure 11: 38.24% of the participants believe that the natural organs are less expensive when compared to the artificial ones and 34.31% believe that artificial organs could be costeffective. The remaining 27.45% population think that there is no big difference between the two in terms of cost. Figure 12: 53.92% population think that there can be side effects for artificial organs and 29.41% disagree to that. The rest 16.67% have no idea about the risk factors. Figure 13: 44.12% population think that even patients with medical disabilities can accept artificial organs. 36.27% disagree with that and the rest 19.61% have no idea. Figure 14: 40.2% think that artificial organs are made of living tissues and 25.49% think that they are made of plastics. The rest have 12.75% no idea or they are unaware and 21.57% think that they are made of metals. Figure 15: 51.96% think that the artificial organs are developed using 3D-printers and 24.51% think that chemicals are used and 23.53% have no idea. The limitation to this study is that it includes less population size and less inclusion of criteria. Awareness about these artificial organs can render to more knowledge in the field of organ transplantation. It can be a great advantage to engineer more artificial organs for transplants. CHI square analysis was also done, and results are shown Figure 16-29.
Figure 11: Descriptive analysis on cost effectiveness of artificial organs. 34.31% say it is artificial organs (red), 38.24% say it is natural organs (green) and 27.45 have no idea (blue).
Figure 12 Descriptive analysis on awareness of side effects of artificial organs. 53.92 are aware that there can be side effects for artificial organs (red), 29.41% are unaware (blue) and 16.67% are not sure of their answer (green).
Figure 13: Descriptive analysis of whether people with medical disabilities can accept artificial organs. 44.12% say yes (red), 36.37% say no (blue) and 19.61% are unaware (green).
Figure 14: Descriptive analysis on knowledge about major components of artificial organs. 39.2% say it's made of living tissues (orange), 25.49% say it is made of plastics (green), 22.55% say that it is made of metals (red) and 12.75% have no idea about it (blue).
Figure 15: Descriptive analysis of knowledge on how artificial organs are engineered. 51.96% 3D printers (green), 24.51% chemicals (red) and 23.53% are not aware (blue).
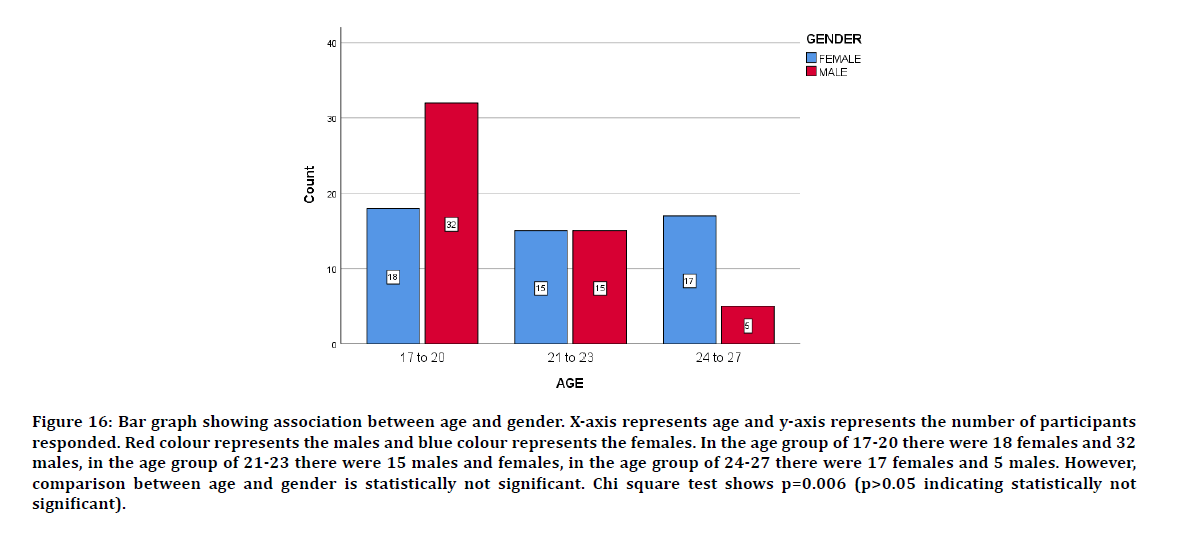
Figure 16: Bar graph showing association between age and gender. X-axis represents age and y-axis represents the number of participants responded. Red colour represents the males and blue colour represents the females. In the age group of 17-20 there were 18 females and 32 males, in the age group of 21-23 there were 15 males and females, in the age group of 24-27 there were 17 females and 5 males. However, comparison between age and gender is statistically not significant. Chi square test shows p=0.006 (p>0.05 indicating statistically not significant).
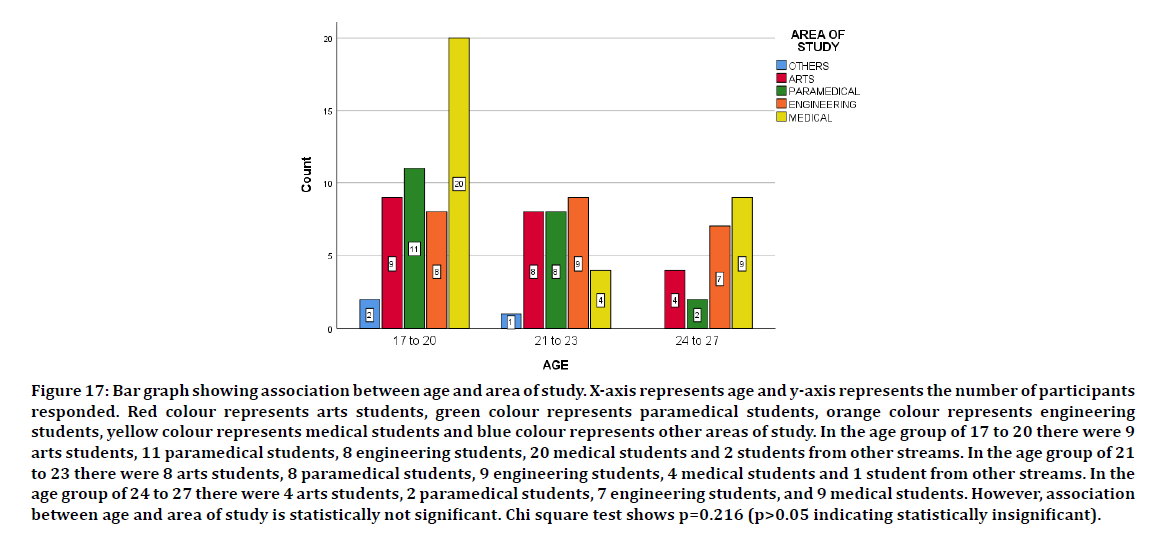
Figure 17: Bar graph showing association between age and area of study. X-axis represents age and y-axis represents the number of participants responded. Red colour represents arts students, green colour represents paramedical students, orange colour represents engineering students, yellow colour represents medical students and blue colour represents other areas of study. In the age group of 17 to 20 there were 9 arts students, 11 paramedical students, 8 engineering students, 20 medical students and 2 students from other streams. In the age group of 21 to 23 there were 8 arts students, 8 paramedical students, 9 engineering students, 4 medical students and 1 student from other streams. In the age group of 24 to 27 there were 4 arts students, 2 paramedical students, 7 engineering students, and 9 medical students. However, association between age and area of study is statistically not significant. Chi square test shows p=0.216 (p>0.05 indicating statistically insignificant).
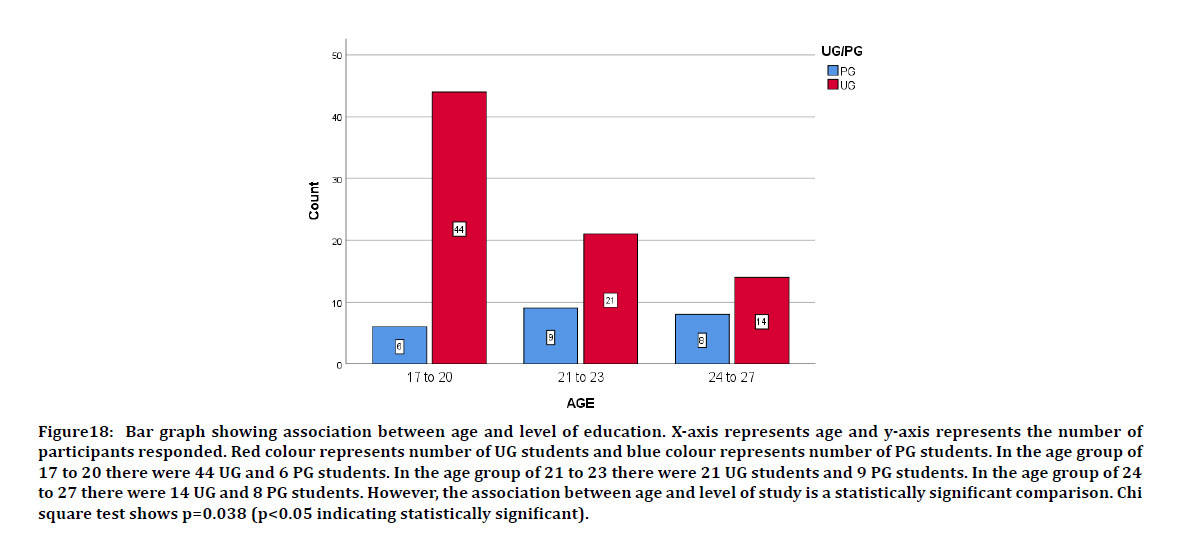
Figure 18: Bar graph showing association between age and level of education. X-axis represents age and y-axis represents the number of participants responded. Red colour represents number of UG students and blue colour represents number of PG students. In the age group of 17 to 20 there were 44 UG and 6 PG students. In the age group of 21 to 23 there were 21 UG students and 9 PG students. In the age group of 24 to 27 there were 14 UG and 8 PG students. However, the association between age and level of study is a statistically significant comparison. Chi square test shows p=0.038 (p<0.05 indicating statistically significant).
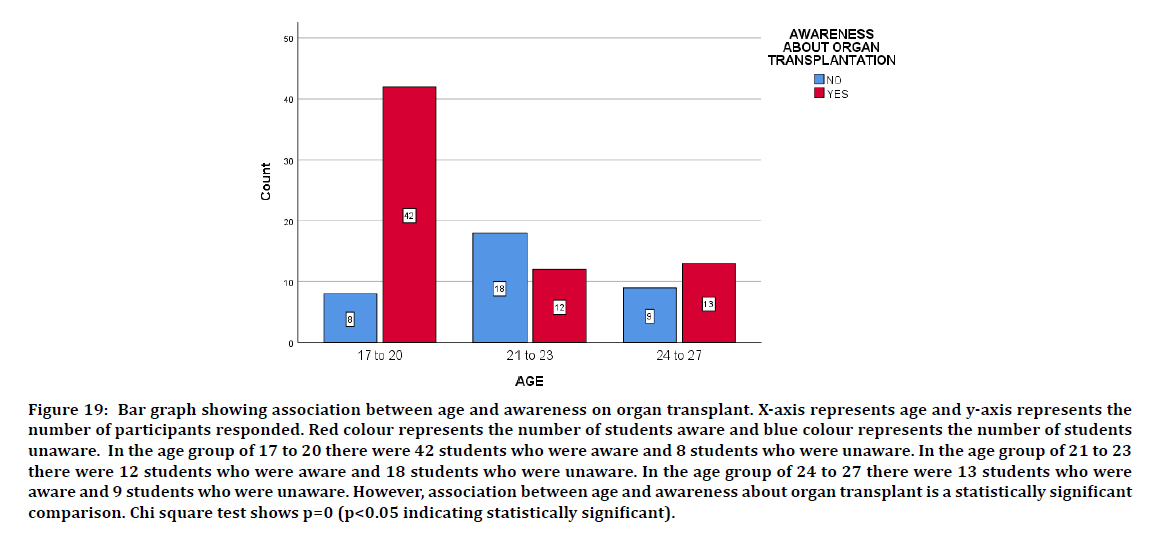
Figure 19: Bar graph showing association between age and awareness on organ transplant. X-axis represents age and y-axis represents the number of participants responded. Red colour represents the number of students aware and blue colour represents the number of students unaware. In the age group of 17 to 20 there were 42 students who were aware and 8 students who were unaware. In the age group of 21 to 23 there were 12 students who were aware and 18 students who were unaware. In the age group of 24 to 27 there were 13 students who were aware and 9 students who were unaware. However, association between age and awareness about organ transplant is a statistically significant comparison. Chi square test shows p=0 (p<0.05 indicating statistically significant).
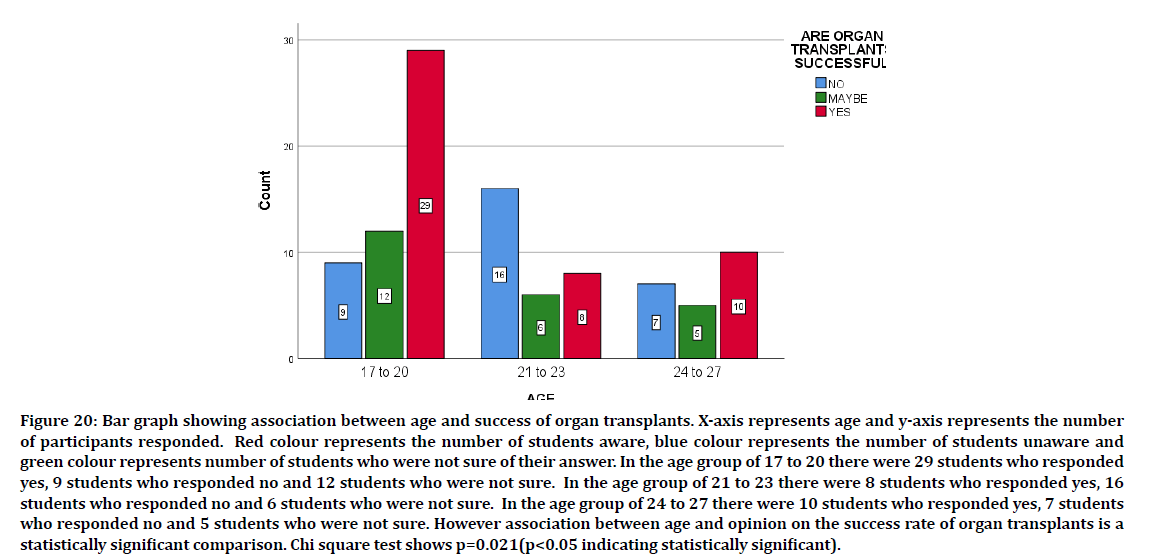
Figure 20: Bar graph showing association between age and success of organ transplants. X-axis represents age and y-axis represents the number of participants responded. Red colour represents the number of students aware, blue colour represents the number of students unaware and green colour represents number of students who were not sure of their answer. In the age group of 17 to 20 there were 29 students who responded yes, 9 students who responded no and 12 students who were not sure. In the age group of 21 to 23 there were 8 students who responded yes, 16 students who responded no and 6 students who were not sure. In the age group of 24 to 27 there were 10 students who responded yes, 7 students who responded no and 5 students who were not sure. However association between age and opinion on the success rate of organ transplants is a statistically significant comparison. Chi square test shows p=0.021(p<0.05 indicating statistically significant).
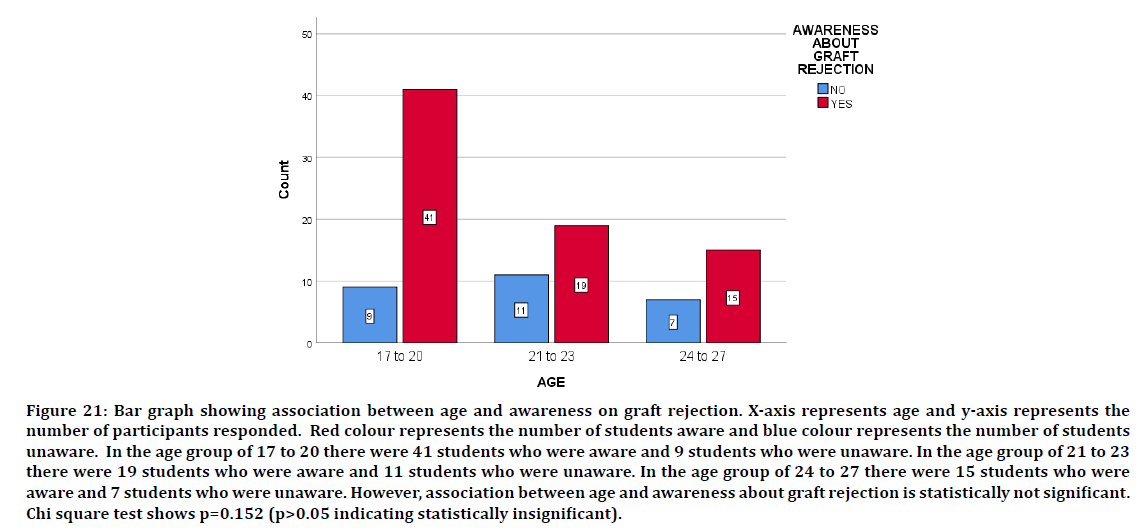
Figure 21: Bar graph showing association between age and awareness on graft rejection. X-axis represents age and y-axis represents the number of participants responded. Red colour represents the number of students aware and blue colour represents the number of students unaware. In the age group of 17 to 20 there were 41 students who were aware and 9 students who were unaware. In the age group of 21 to 23 there were 19 students who were aware and 11 students who were unaware. In the age group of 24 to 27 there were 15 students who were aware and 7 students who were unaware. However, association between age and awareness about graft rejection is statistically not significant. Chi square test shows p=0.152 (p>0.05 indicating statistically insignificant).
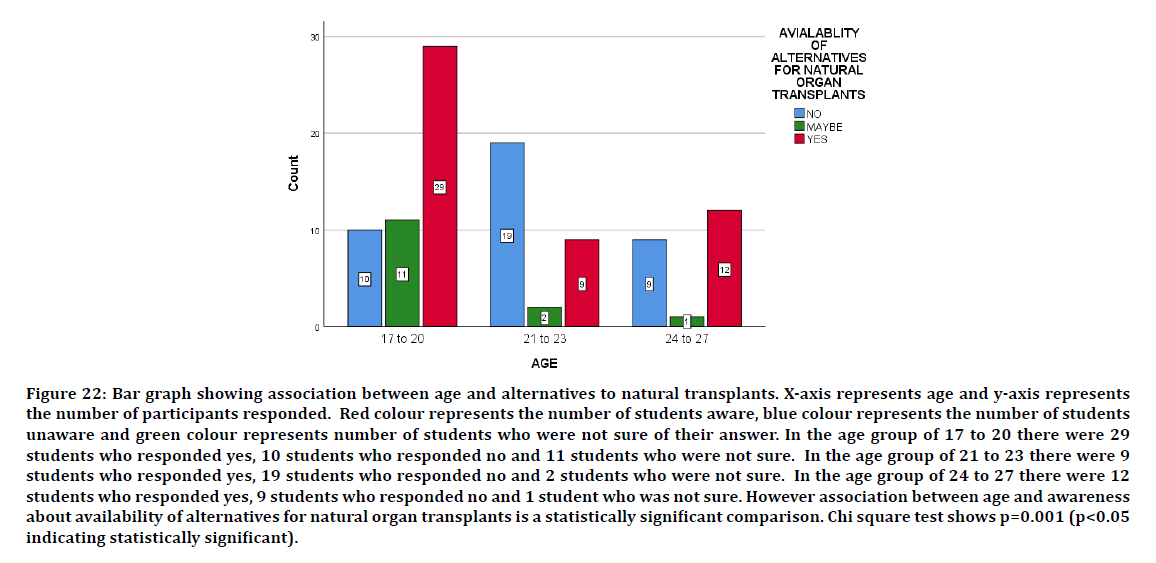
Figure 22: Bar graph showing association between age and alternatives to natural transplants. X-axis represents age and y-axis represents the number of participants responded. Red colour represents the number of students aware, blue colour represents the number of students unaware and green colour represents number of students who were not sure of their answer. In the age group of 17 to 20 there were 29 students who responded yes, 10 students who responded no and 11 students who were not sure. In the age group of 21 to 23 there were 9 students who responded yes, 19 students who responded no and 2 students who were not sure. In the age group of 24 to 27 there were 12 students who responded yes, 9 students who responded no and 1 student who was not sure. However association between age and awareness about availability of alternatives for natural organ transplants is a statistically significant comparison. Chi square test shows p=0.001 (p<0.05 indicating statistically significant).
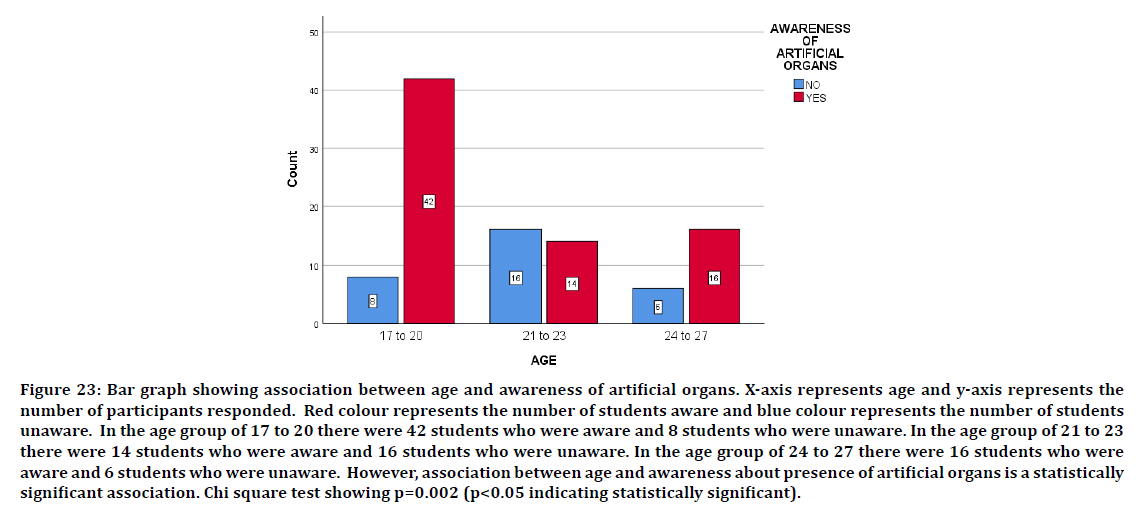
Figure 23: Bar graph showing association between age and awareness of artificial organs. X-axis represents age and y-axis represents the number of participants responded. Red colour represents the number of students aware and blue colour represents the number of students unaware. In the age group of 17 to 20 there were 42 students who were aware and 8 students who were unaware. In the age group of 21 to 23 there were 14 students who were aware and 16 students who were unaware. In the age group of 24 to 27 there were 16 students who were aware and 6 students who were unaware. However, association between age and awareness about presence of artificial organs is a statistically significant association. Chi square test showing p=0.002 (p<0.05 indicating statistically significant).
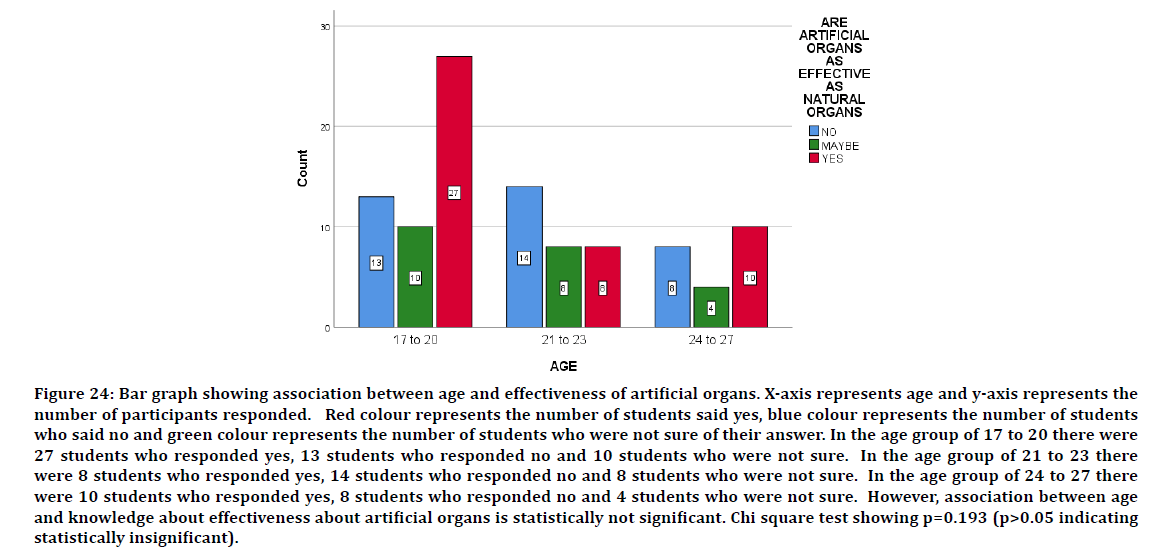
Figure 24: Bar graph showing association between age and effectiveness of artificial organs. X-axis represents age and y-axis represents the number of participants responded. Red colour represents the number of students said yes, blue colour represents the number of students who said no and green colour represents the number of students who were not sure of their answer. In the age group of 17 to 20 there were 27 students who responded yes, 13 students who responded no and 10 students who were not sure. In the age group of 21 to 23 there were 8 students who responded yes, 14 students who responded no and 8 students who were not sure. In the age group of 24 to 27 there were 10 students who responded yes, 8 students who responded no and 4 students who were not sure. However, association between age and knowledge about effectiveness about artificial organs is statistically not significant. Chi square test showing p=0.193 (p>0.05 indicating statistically insignificant).
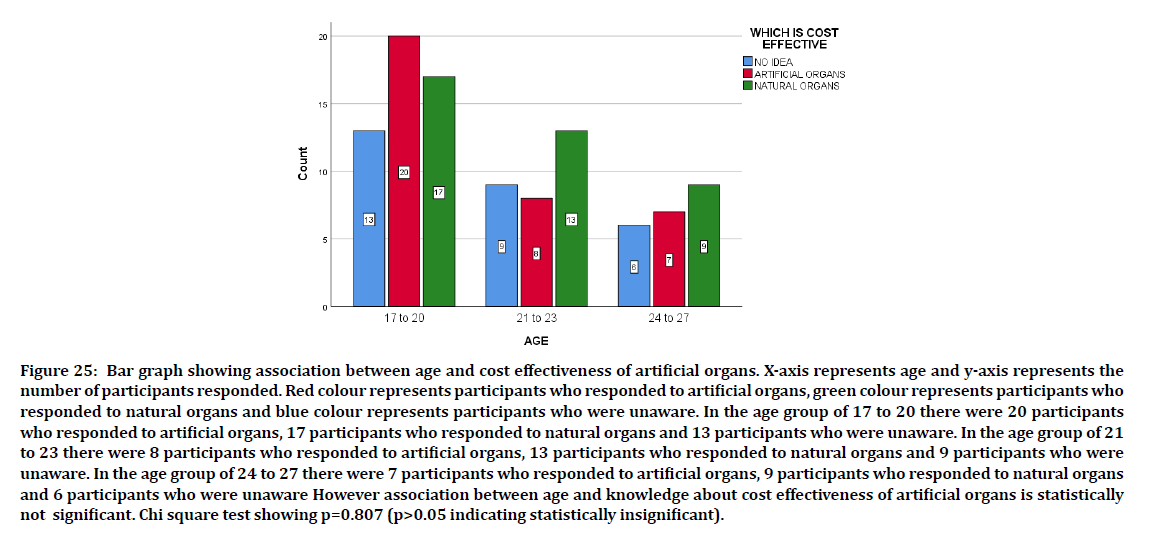
Figure 25: Bar graph showing association between age and cost effectiveness of artificial organs. X-axis represents age and y-axis represents the number of participants responded. Red colour represents participants who responded to artificial organs, green colour represents participants who responded to natural organs and blue colour represents participants who were unaware. In the age group of 17 to 20 there were 20 participants who responded to artificial organs, 17 participants who responded to natural organs and 13 participants who were unaware. In the age group of 21 to 23 there were 8 participants who responded to artificial organs, 13 participants who responded to natural organs and 9 participants who were unaware. In the age group of 24 to 27 there were 7 participants who responded to artificial organs, 9 participants who responded to natural organs and 6 participants who were unaware However association between age and knowledge about cost effectiveness of artificial organs is statistically not significant. Chi square test showing p=0.807 (p>0.05 indicating statistically insignificant).
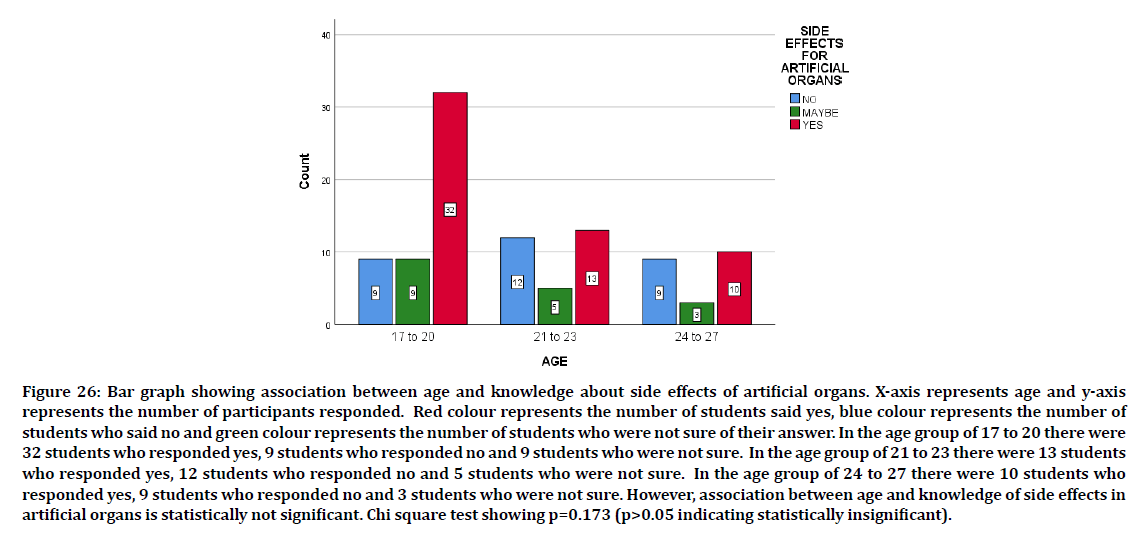
Figure 26: Bar graph showing association between age and knowledge about side effects of artificial organs. X-axis represents age and y-axis represents the number of participants responded. Red colour represents the number of students said yes, blue colour represents the number of students who said no and green colour represents the number of students who were not sure of their answer. In the age group of 17 to 20 there were 32 students who responded yes, 9 students who responded no and 9 students who were not sure. In the age group of 21 to 23 there were 13 students who responded yes, 12 students who responded no and 5 students who were not sure. In the age group of 24 to 27 there were 10 students who responded yes, 9 students who responded no and 3 students who were not sure. However, association between age and knowledge of side effects in artificial organs is statistically not significant. Chi square test showing p=0.173 (p>0.05 indicating statistically insignificant).
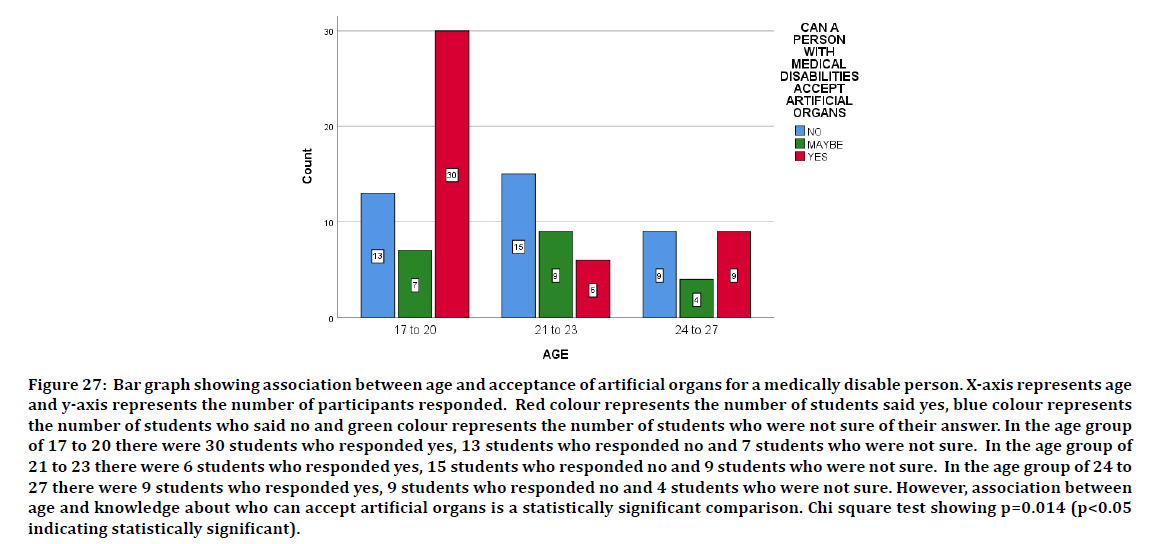
Figure 27: Bar graph showing association between age and acceptance of artificial organs for a medically disable person. X-axis represents age and y-axis represents the number of participants responded. Red colour represents the number of students said yes, blue colour represents the number of students who said no and green colour represents the number of students who were not sure of their answer. In the age group of 17 to 20 there were 30 students who responded yes, 13 students who responded no and 7 students who were not sure. In the age group of 21 to 23 there were 6 students who responded yes, 15 students who responded no and 9 students who were not sure. In the age group of 24 to 27 there were 9 students who responded yes, 9 students who responded no and 4 students who were not sure. However, association between age and knowledge about who can accept artificial organs is a statistically significant comparison. Chi square test showing p=0.014 (p<0.05 indicating statistically significant).
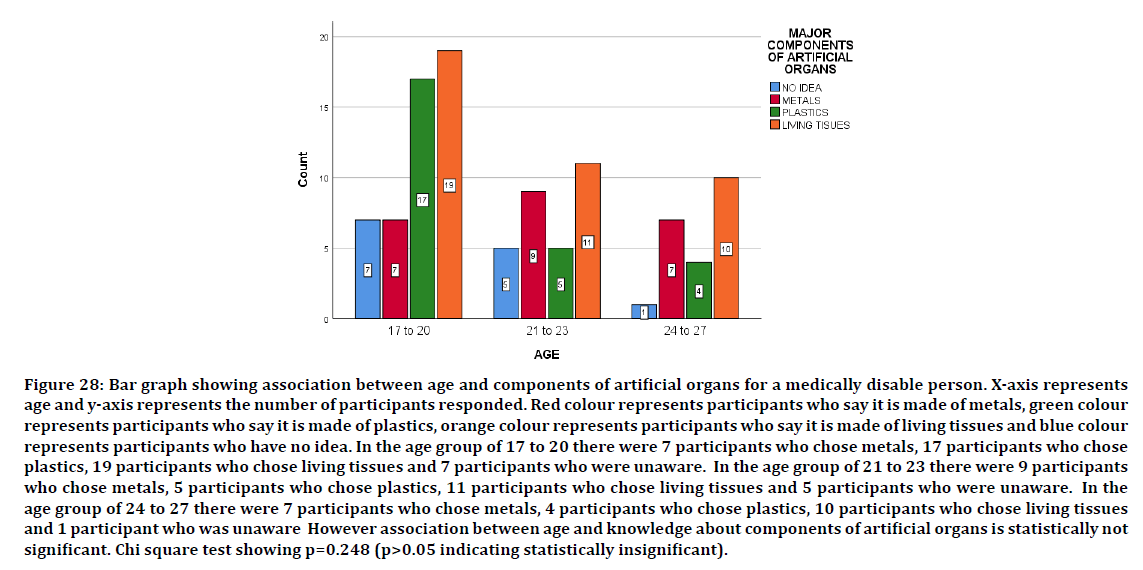
Figure 28: Bar graph showing association between age and components of artificial organs for a medically disable person. X-axis represents age and y-axis represents the number of participants responded. Red colour represents participants who say it is made of metals, green colour represents participants who say it is made of plastics, orange colour represents participants who say it is made of living tissues and blue colour represents participants who have no idea. In the age group of 17 to 20 there were 7 participants who chose metals, 17 participants who chose plastics, 19 participants who chose living tissues and 7 participants who were unaware. In the age group of 21 to 23 there were 9 participants who chose metals, 5 participants who chose plastics, 11 participants who chose living tissues and 5 participants who were unaware. In the age group of 24 to 27 there were 7 participants who chose metals, 4 participants who chose plastics, 10 participants who chose living tissues and 1 participant who was unaware However association between age and knowledge about components of artificial organs is statistically not significant. Chi square test showing p=0.248 (p>0.05 indicating statistically insignificant).
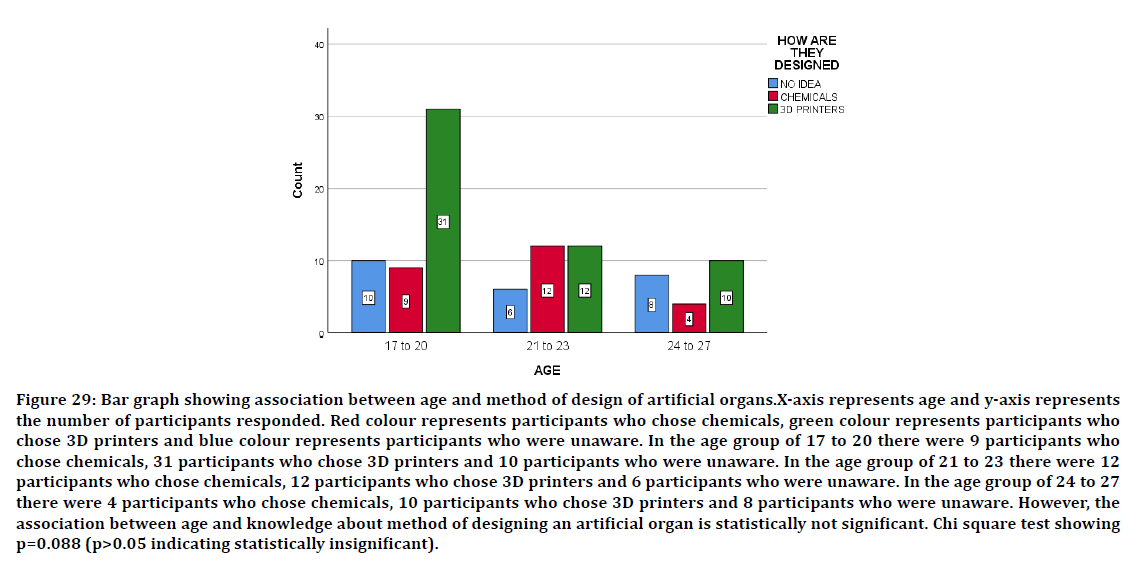
Figure 29: Bar graph showing association between age and method of design of artificial organs.X-axis represents age and y-axis represents the number of participants responded. Red colour represents participants who chose chemicals, green colour represents participants who chose 3D printers and blue colour represents participants who were unaware. In the age group of 17 to 20 there were 9 participants who chose chemicals, 31 participants who chose 3D printers and 10 participants who were unaware. In the age group of 21 to 23 there were 12 participants who chose chemicals, 12 participants who chose 3D printers and 6 participants who were unaware. In the age group of 24 to 27 there were 4 participants who chose chemicals, 10 participants who chose 3D printers and 8 participants who were unaware. However, the association between age and knowledge about method of designing an artificial organ is statistically not significant. Chi square test showing p=0.088 (p>0.05 indicating statistically insignificant).
Conclusion
Hence the awareness about the complications and risk factors in artificial organ transplantation has been assessed. This survey can mainly bring about general opinions on artificial organs and can lead to advancements in development of artificial organs.
References
- Jain AR, Nallaswamy D, Ariga P et al. Determination of correlation of width of maxillary anterior teeth using extraoral and intraoral factors in Indian population: A systematic review. World J Dent. 2018; 9:68–75.
- Jyothi S, Robin PK, Ganapathy D. Periodontal health status of three different groups wearing temporary partial denture. Res J Pharma Technol 2017; 10:4339–4342.
- Ajay R, Suma K, Ali SA, et al. Effect of surface modifications on the retention of cement-retained implant crowns under fatigue loads: An In vitro Study. J Pharm Bioallied Sci 2017; 9:154–160.
- Ranganathan H, Ganapathy DM, Jain AR. Cervical and incisal marginal discrepancy in ceramic laminate veneering materials: A SEM analysis. Contemp Clin Dent 2017; 8:272–278.
- http://www.indianjournals.com/ijor.aspx?target=ijor:rjpt&volume=11&issue=7&article=068
- Duraisamy R, Krishnan CS, Ramasubramanian H, et al. Compatibility of nonoriginal abutments with implants: Evaluation of microgap at the implant–abutment interface, with original and nonoriginal abutments. Implant Dent 2019; 28:289.
- Ganapathy DM, Kannan A, Venugopalan S. Effect of coated surfaces influencing screw loosening in implants: A systematic review and meta-analysis. World J Dent 2017; 8:496–502.
- Ashok V, Nallaswamy D, Benazir Begum S et al. Lip bumper prosthesis for an acromegaly patient: A clinical report. J Indian Prosthodont Soc 2014; 14:279–282.
- Vijayalakshmi B, Ganapathy D. Medical management of cellulitis. J Pharm Res. 2016; 9:2067-2070.
- Selvan SR, Ganapathy D. Efficacy of fifth generation cephalosporins against methicillin-resistant Staphylococcus aureus-A review. J Pharm Res 2016; 9:1815-1818.
- Ashok V, Suvitha S. Awareness of all ceramic restoration in rural population. J Pharm Res. 2016; 9:1691-16913.
- Ganapathy D, Sathyamoorthy A, Ranganathan H, et al. Effect of resin bonded luting agents influencing marginal discrepancy in all ceramic complete veneer crowns. J Clin Diagn Res 2016; 10:67–70.
- Rana A, Godfrey EL. Outcomes in solid-organ transplantation: Success and stagnation. Tex Heart Inst J 2019; 46:75–86.
- Ghaemi F, Ghaemi F, Zamyad M. Survival rate in lung, liver, heart and pancreas transplant recipients in iran: A registry-based study. Int J Organ Transplant Med. 2013; 4:118–121.
- Lubeck DP. The artificial heart: Costs, risks, and benefits—An update. Int J Technol Assess Health Care 1986; 2:369–386.
- Van Citters RL, Bauer CB, Christopherson LK, et al. Artificial heart and assist devices: directions, needs, costs, societal and ethical issues. Artif Organs 1985; 9:375–415.
- Subasree S, Murthykumar K. Effect of aloe vera in oral health-A review. J Pharm Res 2016; 9:609-612.
- Venugopalan S, Ariga P, Aggarwal P, et al. Case report: Magnetically retained silicone facial prosthesis. Niger J Clin Pract 2014; 17:260–264.
- Gray NA, Selzman CH. Current status of the total artificial heart. Am Heart J 2006; 152:4–10.
- Kannan A, Venugopalan S. A systematic review on the effect of use of impregnated retraction cords on gingiva. J Pharm Res 2018; 11:2121-2126.
- Devi K, Leondra L, Poovitha R. A community-based study on awareness of organ donation among young adults in rural areas of Puducherry. Int J Community Med Public Health 2018; 5:3469–3477.
- Tamuli RP, Sarmah S, Saikia B. Organ donation-attitude and awareness among undergraduates and postgraduates of North-East India. J Family Med Prim Care 2019; 8:130–136.
- Sam N, Ganesh R, Indrapriyadarshini V. Awareness, knowledge, and attitude regarding organ donation among final year students of medical. Indian J Transplantation 2018; 12:25.
- Saleem T, Ishaque S, Habib N, et al. Knowledge, attitudes, and practices survey on organ donation among a selected adult population of Pakistan. BMC Med Ethics. 2009; 10:5.
- Oluyombo R, Fawale MB, Ojewola RW, et al. Knowledge regarding organ donation and willingness to donate among health workers in South-West Nigeria. Int J Organ Transplant Med 2016; 7:19–26.
Author Info
Obuli Ganesh Kishore S1, Keerthi Sasanka2*, Jothi Priya A3 and Dhanraj Ganapathy2
1Department of Anatomy, Saveetha Dental College and Hospital, Saveetha Institute of Medical and Technical Sciences, Saveetha University Tamilnadu, Chennai, India2Department of Prosthodontics, Saveetha Dental College and Hospital, Saveetha Institute of Medical and Technical Sciences, Saveetha University Tamilnadu, Chennai, India
3Department of Physiology, Saveetha Dental College and Hospital, Saveetha Institute of Medical and Technical Sciences, Saveetha University Tamilnadu, Chennai, India
Citation: Obuli Ganesh Kishore S, Keerthi Sasanka, Jothi Priya A, Dhanraj Ganapathy,Awareness About Risk Factors and Complications in Artificial Organ Transplantation: A Survey Based Analysis, J Res Med Dent Sci, 2020, 8 (7): 193-203.
Received: 27-Sep-2020 Accepted: 26-Oct-2020 Published: 02-Nov-2020

