Research - (2021) Volume 9, Issue 5
Correlation of the Pre-Pregnancy BMI with the Neonatal Outcomes
Blessy David, E Chandra and K Vani*
*Correspondence: K Vani, Department of Obstetrics and Gynecology, Sree Balaji Medical College & Hospital Affiliated to Bharath Institute of Higher Education and Research, Chennai, Tamil Nadu, India, Email:
Abstract
A prospective, randomized study was designed to study and correlate the pre-pregnancy BMI with the various obstetric outcomes like abortions, duration of the pregnancy, onset of labour, mode of delivery and intrapartum and postpartum complications. The Present study focuses on to correlate the pre-pregnancy BMI with the neonatal outcomes like baby weight, APGAR scores and admission of the baby to the neonatal intensive care unit (NICU).
Keywords
Pre-pregnancy BMI, Labour, APGAR, NICU, Intrapartum complications
Introduction
Maternal nutritional status is one of the most important factors of fetal growth and development. "In every region of the world, obesity has doubled between 1980 and 2008," says Dr. Ties Boema, Director of the Department of Health Statistics and Information Systems at World Health Organization (WHO). In a Lancet study in 2014, researchers have claimed that there is a startling increase (28%) in the rates of obesity and overweight in adults in the past 33 years with the number of overweight and obese people rising from 857 million in 1980 to 2.1 billion in 2013.Obesity has reached epidemic proportions m India in the 21st century, with morbid obesity affecting 5% of the country's population.
Tamil Nadu ranks 4th after 11 jan, Kerala and Goa with 19.8% males and 24.4% females obese or overweight based on data from the National Family Health Survey 2007. This accounts to the reason that we, Indians have adapted to the cultural modernization and western lifestyle. Unhealthy processed food has become more accessible following India's continued integration in global food markets. This, combined with rising middle-class incomes is increasing the average caloric intake per individual among the middle class and above households. The prevalence of obesity in pregnancy has been increasing along with the prevalence of obesity in general population. This has prompted the American College of Obstetricians and Gynecologists (ACOG) to recommend that the body mass index (BMI) be recorded for all women at the initial prenatal visit, and that information concerning the maternal and fetal risks of abnormal BMI in pregnancy should be provided4. WHO in 2009 announced obesity in pregnancy as one of the important non-communicable diseases that threaten maternal and child health? Generally, the reported prevalence was about 4.7% - 38%2 but there is no definite prevalence report in Indian pregnant women.
We have recently observed that, both types of malnutrition (underweight and overweight and obesity) are associated with adverse pregnancy outcomes. Many studies have found that Gestational Diabetes Mellitus, preeclampia, Caesarean section, postpartum hemorrhage, wound infection, preterm delivery, large for gestational babies and intrauterine fetal demise were more common in obese mothers 6 7 8 Similarly, fetuses of pregnant women who are overweight or obese are at increased risk of prematurity, still birth, congenital anomalies, macrosomia with possible head injuries and childhood obesity9. On the contrary, in a developing country like India we also face the problem of low BMI because of the high prevalence of malnutrition. Complications related to underweight mothers are anaemia, premature rupture of membranes (PROM), low APGAR scores, low birth weight babies, preterm delivery and increased perinatal mortality.
Most of these studies are from the United States and Europe and thus emphasizes the need for this study. The aim of this study was to evaluate the correlation between the pre-pregnancy maternal body mass index (BMI) and obstetrical and fetal outcomes in women delivered at the Department of Obstetrics and Gynaecology, Sree Balaji Medical College & Hospital, Chrompet, Chennai. It is better to prevent disease than to cure it, and antenatal care is a perfect example of preventive medicine. The aim of antenatal care is to ensure the wellbeing of mother and child. This objective can be subdivided into the screening and /or prevention of maternal and fetal problems, and the preparation of couple for childbirth and childbearing. Though all mothers and children are vulnerable to disease or disability, there are certain mothers and infants who are at increased or special risk of complications of pregnancy/ labor or both. "A risk factor is defined as any ascertainable characteristic or circumstance of a person (or group of such persons) known to be associated with an abnormal risk of developing or being adversely affected by a morbid process" (WHO, 1973). Risk factors can be used to predict causes or signal, which are identifiable before the chain of event and unforeseen complication that can follow.
High-risk pregnancy identification is a challenging work. Many indicators have been developed to recognize high-risk pregnancy. The determination of high-risk pregnancy indicators is aimed to help the obstetricians to identify the patients in need of special attention, and to elaborate a prognosis for them. To fulfill this need, several high-risk identification systems have been developed, but they are not suitable for all population 14 . The aim of the risk approach is to predict problems before they arrive so that women designated as high-risk can receive special attention and further care in hospital setting. Two of the important determinants of obstetric risk consist of maternal height and weight. Many studies and literature stress on the use of these indicators for identification of high-risk pregnancy. In developing countries, there is a need for the development of indicators which can be utilized at primary health care level easily. Several studies recommend the use of maternal height and weight as simple and sensitive indicators of pregnancy outcome. They are especially useful for prediction of mode of delivery, low birth weight babies and birth asphyxia. WHO collaborative study15 of maternal anthropometry and pregnancy outcome recommend the use of maternal height and weight for screening in its service application? A woman's prepregnancy body mass index (BMI) has been used as a marker of her nutritional status. Being underweight, may reflect chronic nutritional deficiency, whereas a high BMI reflects an imbalance between energy intake and expenditure and thus varying degrees of adiposity.
The Body Mass Index (BMI), or Quetelet index, is a statistical measurement which compares the patience's height and weight. Though it does not actually measure the percentage of body fat, it is used to estimate a healthy body weight based on how tall a person is. Due to its ease of measurement and calculation, it is the most widely used diagnostic tool to identify weight problems within a population, whether individuals are underweight, overweight or obese. It was invented between 1830 and 1850 by the Belgian polymath Adolphe Quetelet during the course of developing "social physics" 16. The advantage of using this index, rather than weight alone is that it is height independent, such that tall and short people of similar proportions have a similar BMI. A large body of data links a high pre-pregnancy BMI with a number of fetal and maternal complications including fetal death, pre-eclampsia, gestational diabetes, and macrosomia Obesity is fast becoming one of the major health problems and being pregnant contributes further to obesity. Maternal and neonatal complications associated with BMI are of public health importance because they add to the disease burden in women and children and increase medical costs. The association of pre-pregnancy body mass index (BMI) has been thoroughly studied as a predictor of adverse pregnancy outcomes mainly because of the belief that it is potentially modifiable before conception [1-4].
Materials and Methods
This study was conducted after getting ethical clearance from the University ethical committee. In the present study, the pre-pregnant Body Mass Index (BMI) of 300 pregnant women with singleton pregnancy attending the antenatal clinic was calculated and they were placed in standard BMI categories and the obstetric outcome variables were evaluated.
Type of study
Prospective study.
Study population
300 pregnant women with singleton pregnancy based on the inclusion and exclusion criteria.
Study setting
Department of Obstetrics and Gynaecology, Sree Balaji Medical College and hospital, Chrompet, Chennai.
Inclusion criteria
✓ Age of 18 - 35 years.
✓ Singleton pregnancy.
✓ 1st trimesters visit for confirmation of pregnancy.
✓ Spontaneous conception.
✓ Patients who can self-report their prepregnancy BMI or have a record of it.
Exclusion criteria
✓ History of Gestational Diabetes Mellites or Hypertension in the previous pregnancy.
✓ Diagnosed Diabetes Mellites, Hypertension, Hypothyroidism or Renal Diseases.
✓ Women with multiple pregnancy.
✓ Women with previous Caesarean Section.
Methodology
Detailed history including the obstetric score, last menstrual period (LMP), estimated due date (EDD), gestational age was taken and thorough general physical examination was done at the onset of the study. Routine antenatal care was given to all the subjects.
First trimester (up to 12 weeks)
Early ultrasound scan between 10 weeks and 13 weeks 6 days was done to determine the gestational age and to note the nuchal translucency, nasal bone visualization and Ductus venous flow. Folic acid supplements were given throughout the first 12 weeks.
Second trimester (12-28 weeks)
At each visit, Blood pressure was noted and thorough general examination was conducted including an abdominal examination to look for the fundal height, fetal heart and position of the fetus. Fetal heart sound was heard by Pinard' s fetal stethoscope after the 20th week of pregnancy. Haemoglobin and Urine routine analysis and presence of sugar and protein was tested every 4 weeks.
Third trimester (28 weeks till delivery)
Iron and Calcium supplements were continued. Oral Glucose Challenge Test (OGCT) was repeated at 32 - 34 weeks if it was normal the previous two times. Pelvic assessment was done at 38 w eks. Any abnormal observation or if the patient developed any complication at any time of the study it should be documented. Management of the complications was implemented.
Outcome variables
The outcome variables of the study included:
Development of hypothyroidism
Hypothyroidism was diagnosed if the Thyroid Stimulating Hormone (TSH) was more than 2.5μIU/ml in the first trimester and more than 3μIU/ml in the second and third trimesters.
Development of anaemia
The Indian Council of Medical Research recommends the following categories of anemia (Table 1).
Table 1: Categories of anemia.
| Anaemia Severity | Haemoglobin level (g/dl) |
|---|---|
| Mild | 10-10.9 |
| Moderate | 07-Oct |
| Severe | 04-Jul |
| Very Severe | <4 |
Mode of delivery
Normal vaginal delivery, Caesarean section.
Both elective and emergency and Instrumental Vaginal Delivery with indications.
Birth weight of baby.
APGAR Scores - at 1 minute and 5 minutes.
Need for NICU admission
Postpartum complications - postpartum hemorrhage, infections.
Statistical analysis
Statistical analysis was done using SPSS version 17. Categorical variables were reported using number and percentages. Trend Chi-squire test and Fisher's Exact Test was done to find the association between the BMI categories and the outcome variables. P value < 0.05 was consider ed to be significant.
Results
Table 2 and Figure 1 shows that there is a significant increasing trend in spontaneous abortions in increased BMI groups (p=0.026). Table 3 and Figure 1 shows that though there is an increase in the rates of medically indicated abortions in overweight and obesegroup, the increase was not statistically significant (p=0.266 more than 0.05).
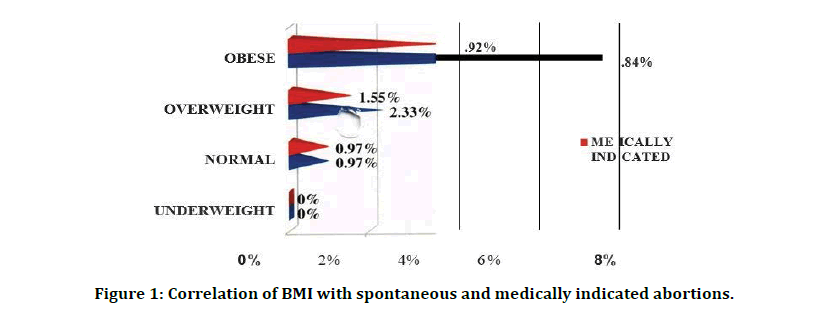
Figure 1: Correlation of BMI with spontaneous and medically indicated abortions.
Table 2: Correlation of BMI and spontaneous abortion.
| Chi-Square Test | Value | P- Value |
|---|---|---|
| Trend Chi-Square Test | 5.452 | 0.026 |
Table 3: Correlation of BMI and medically indicated abortion.
| Chi-Square Test | Value | P- Value |
|---|---|---|
| Trend Chi-Square Test | 1.825 | 0.266 |
Table 4 and Figure 2 shows that 37.82% (n=104) of women experienced induction of labor (4% (n=l 2) of population who underwent elective cesarean delivery are deleted). This shows that greater pre-pregnancy BMI was significantly related to an increased risk of induction (P=0.032).
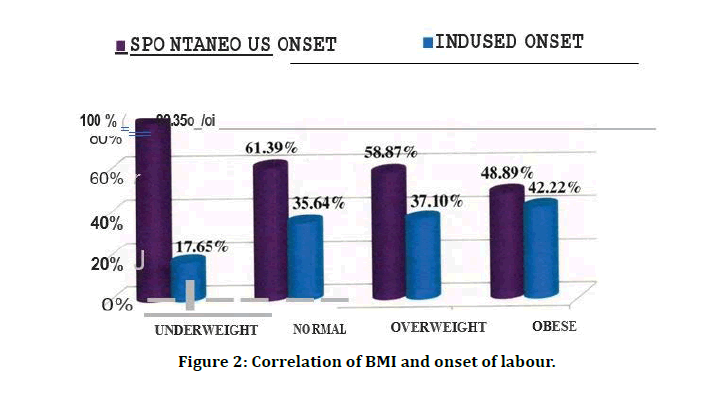
Figure 2: Correlation of BMI and onset of labour.
Table 4: Correlation of BMI and onset of labour.
| BMI classification | Spontanious | Indused | Total | |
|---|---|---|---|---|
| Under weight | 14 (82.35%) | 3 (17.65%) | 17 (100%) | |
| Normal | 62 (63.27%) | 36 (36.73%) | 98 (100%) | |
| Over weight | 73 (61.34%) | 46 (38.66%) | 119 (100%) | |
| Obese | 22 (53.66%) | 19 (46.34%) | 41 (100%) | |
| Total % | 171 (62.18%) | 104 (37.82%) | 275 (100%) | |
| Chi-SQuare Test | Value | PVALUE | ||
| Trend Chi-Square Test | 4.604 | 0.032 | ||
Table 5 shows 52.61% (n=151) of women had normal vaginal deliveries, and 36.24% (n=104) had unplanned (Emergency) cesarean births. 18 women (6.27%) had planned elective cesarean births. The remaining 4.88% (n=14) h instrumental vaginal deliveries. Table 6 and Figure 3 shows a significant linear trend in the decrease of normal delivery rates as the BMI increases (p<0.001).
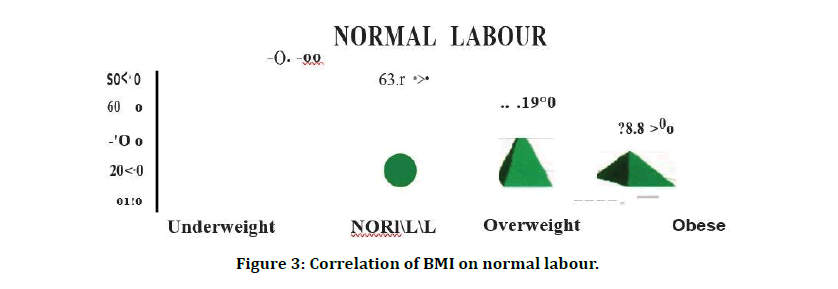
Figure 3: Correlation of BMI on normal labour.
Table 5: Correlation of BMI on mode of delivery.
| BMI classification | VD | Elective Lscs | Emergency Lscs | Instrumental | Total |
|---|---|---|---|---|---|
| Under weight | 13 | 0 | 4 | 0 | 17 |
| % | 76.47% | 0.00% | 23.53% | 0.00% | 100% |
| Normal | 64 | 3 | 33 | 1 | 101 |
| % | 63.37% | 2.97% | 32.67% | 0.99% | 100% |
| Over weight | 61 | 5 | 48 | 10 | 124 |
| % | 49.19% | 4.03% | 38.71% | 8.06% | 100% |
| Obese | 13 | 10 | 19 | 3 | 45 |
| % | 28.89% | 22.22% | 42.22% | 6.67% | 100% |
| Total | 151 | 18 | 104 | 14 | 287 |
| % | 52.61% | 6.27% | 36.24% | 4.88% | 100% |
Table 6: Correlation of BMI on normal labour.
| Chi-Square Test | Value | P-Value |
|---|---|---|
| Trend Chi-Square Test | 9.621 | <0.00l |
Table 7 and Figure 4 shows that there is a significant increase in the need for instrumental delivery as the BMI increases. (p<0.001). Table 8 and Figure 5 shows that there is a significant increasing trend in Elective LSCS in increased BMI groups (p=0.032). Table 9 and Figure 6 shows that there is a significant increasing trend in Emergency LSCS in increased BMI groups (p=0.005).
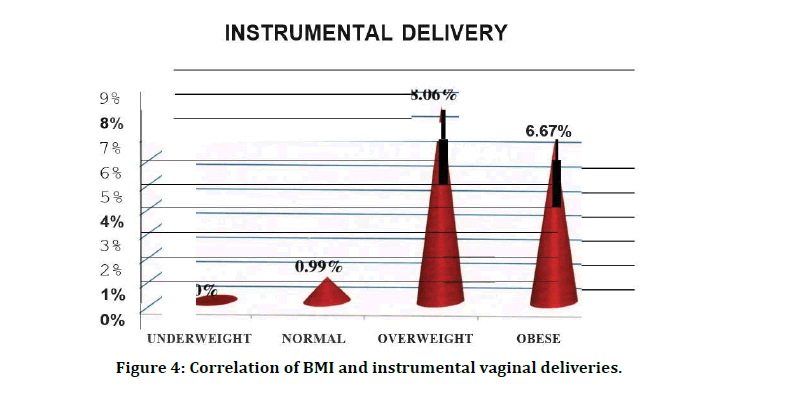
Figure 4: Correlation of BMI and instrumental vaginal deliveries.
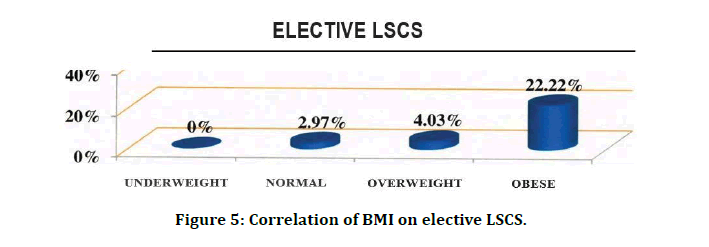
Figure 5: Correlation of BMI on elective LSCS.
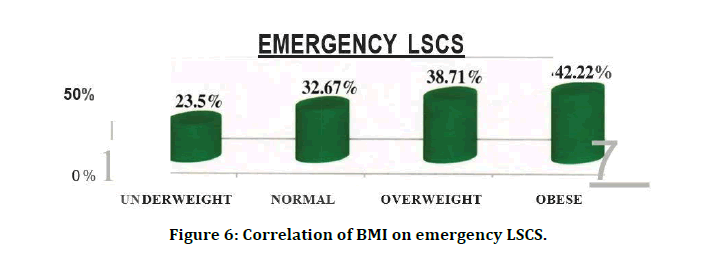
Figure 6: Correlation of BMI on emergency LSCS.
Table 7: Correlation of BMI and instrumental vaginal deliveries.
| Chi-Square Test | Value | P-Value |
|---|---|---|
| Trend Chi-Square Test | 20.074 | <0.001 |
Table 8: Correlation of BMI and elective LSCS.
| Chi-Square Test | Value | P- Value |
|---|---|---|
| Trend Chi-Square Test | 6.231 | 0.032 |
Table 9: Correlation OF BMI AND emergency LSCS.
| Chi-Square Test | Value | P- Value |
|---|---|---|
| Trend Chi-Square Test | 4.825 | 0.005 |
Table 10 shows that 83.27% (n=239) had a term delivery, 7.32% (n=21) had a preterm delivery (<37 weeks) and the remaining 9.41% (n=27) had a prolonged pregnancy (>40 weeks).
Table 11 and Figure 7 shows that a significant association exists between pre-pregnancy BMI and preterm delivery (p=0.029). Table 12 and Figure 8 shows that there is a significant increasing trend in term deliveries increased BMI groups (p=0.012). Table 13 and Figure 9 shows that there is no significant increase in post term deliveries in increased BMI groups (p=0.174).
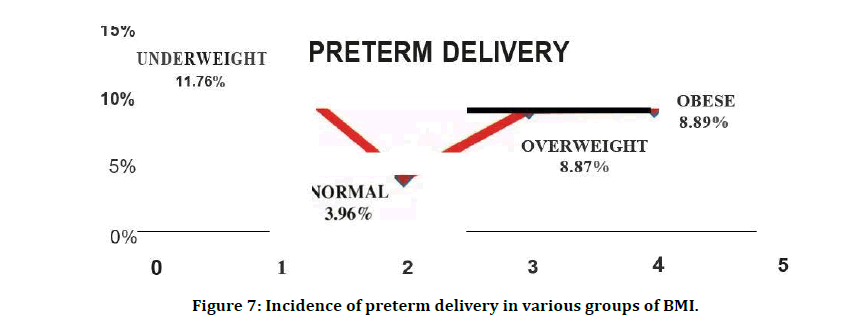
Figure 7: Incidence of preterm delivery in various groups of BMI.
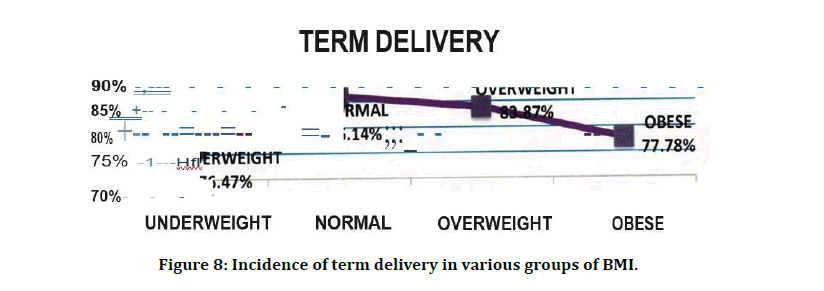
Figure 8: Incidence of term delivery in various groups of BMI.
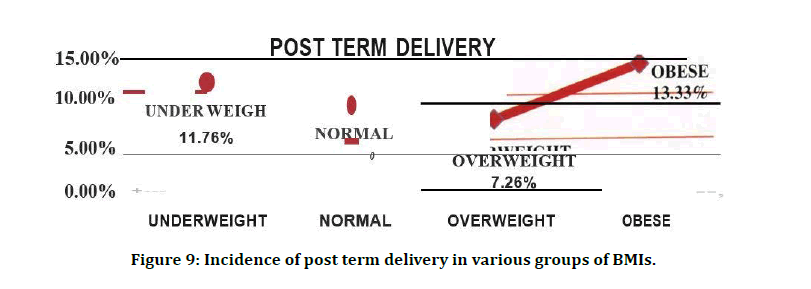
Figure 9: Incidence of post term delivery in various groups of BMIs.
Table 10: Correlation of BMI and the gap at delivery.
| BMI Classification | Pre | Term | Post | Total |
|---|---|---|---|---|
| Under weight | 2 | 13 | 2 | 17 |
| % | 11.76% | 76.47% | 11.76% | 100% |
| Normal | 4 | 87 | 10 | 101 |
| % | 3.96% | 86.14% | 9.90% | 100% |
| Over weight | 11 | 104 | 9 | 124 |
| % | 8.87% | 83.87% | 7.26% | 100% |
| Obese | 4 | 35 | 6 | 45 |
| % | 8.89% | 77.78% | 13.33% | 100% |
| Total | 21 | 239 | 27 | 287 |
| % | 7.32% | 83.27% | 9.41% | 100% |
STILL BORN=2 |
||||
Table 11: Correlation of BMI and preterm delivery.
| Chi-Square Test | Value | P- Value |
|---|---|---|
| Trend Chi-Square Test | 4.287 | 0.029 |
Table 12: Correlation of BMI and term delivery.
| Chi-Square Test | Value | P-Value |
|---|---|---|
| Trend Chi-Square Test | 7.453 | 0.012 |
Table 13: Correlation of BMI and post term delivery.
| Chi-Square Test | Value | P - Value |
|---|---|---|
| Trend Chi-Square Test | 8.153 | 0.174 |
Table 14 and Figure 10 shows 24.04% (n=69) of infants had low birth weight (<2.5kg), 39.72% (n=114) had a birth weight between 2.5-3kg, 27.18% (n=78) had birth weight between 3.0 - 3.5kg, 9.06% (n=26) had birth weight 3.5kg and above. This shows that that lower BMI was significantly associated with low birth weight and as the BMI rises there was an increase in the birth weight of the baby (p=<0.001).
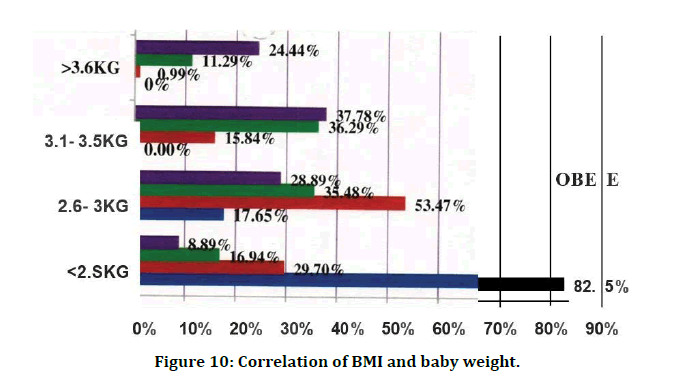
Figure 10: Correlation of BMI and baby weight.
Table 14: Correlation of BMI and baby weight.
| BMI classification | < 2.5 | 2.5 - 3.0 | 3 - 3.5 | > 3.50 | TOTAL | |
|---|---|---|---|---|---|---|
| Under weight | 14 | 3 | 0 | 0 | 17 | |
| % | 82.35% | 17. 65% | 0.00% | 0.00% | 100% | |
| Normal | 30 | 54 | 16 | 1 | 101 | |
| % | 29.70% | 53.47% | 15.84% | 0.99% | 100% | |
| Over weight | 21 | 44 | 45 | 14 | 124 | |
| % | 16.94% | 35.48% | 36.29% | 11.29% | 100% | |
| Obese | 4 | 13 | 17 | 11 | 45 | |
| % | 8.89% | 28.89% | 37.78% | 24.44% | 100% | |
| Total | 69 | 114 | 78 | 26 | 287 | |
| % | 24.04% | 39.72% | 27.18% | 9.06% | 100% | |
| Chi-Square Test | Value | P - Value | ||||
| Trend Chi-Square Test | 46.857 | <0.001 | ||||
Stillborn 2
Discussion
In Mode of delivery overall, 52.61% (n=151) of women had normal vaginal deliveries, and 36.24% (n=104) had unplanned (Emergency) cesarean births. 18 women (6.27%) had planned elective cesarean births. The remaining 4.88% (n=14) had instrumental vaginal deliveries. A significant association between elective cesarean delivery and higher pre-pregnancy BMI is found in our study (p=0.032). Obese women had the highest incidence of unplanned cesarean (42.22%; n=19), whereas women with a underweight prepregnancy BMI had the lowest incidence (23.53%; n=4) (p=0.005). Cesarean birth rates for women in the normal and high prepregnancy BMI categories were moderate for this sample: 32.67% (n=33) and 38.71% (n=48), respectively.
As in previous studies, our results demonstrate that increasing BMI category is strongly associated with Caesarean section rate. Others conducted a meta-analysis on a cohort study performed from 1996 to 2007 and found that the risk of cesarean section was higher in overweight or obese women than in women with normal BMI. In addition, they mentioned that the risk of emergency cesarean delivery was more than elective, although both were higher with increasing BMI. Many reports have indicated that the higher rate of cesarean section in obese pregnant women is due to neonate size; however, in the absence of macrosomia, this increased risk may be due to the increase in soft tissue in the pelvis that narrows the pelvic outlet and the negative effect of poor pelvic and abdominal tone on fetal position. On univariate analysis, in his study, found that the frequency of emergency cesarean section was increased in prepregnant overweight women. We too, in our study noticed a significant increasing trend in the need for both Emergency LSCS and Elective LSCS in both overweight and obese groups - (p=0.005 and p=0.032 respectively).
Of all the indications ofLSCS-35.25% (n=43) were due to fetal distress but there was no significant association of BMI and fetal distress. 17.21% (n=21) of LSCS was because of cephalopelvic disproportion (CPD). There is a significant increase in the incidence of CPD in overweight (31%; n=9) and obese population (21%; n=11) compared to 3% (n=l) in normal women (p value < 0.05). Other indications like placenta praevia, malpresentation, macrosomia, failed induction, oligohydramnios and labour dystocia did not have any significant association with prepregnancy BMI.
There are conflicting data regarding an increased BMI increasing the risk of requiring an operative vaginal delivery. Some studies report that an increased BMI does not appear to increase the risk of requiring an operative vaginal deliver/ 2'43. In a UK population-based cohort analysis, obese parturients had a greater risk of failure during an instrumental delivery, although they were not at increased risk of requiring an assisted vaginal delivery. It seems, however, that the risk of operative vaginal deliveries increases in women who are severely obese (BMI > 35 kg/m2) or morbidly obese (BMI > 40 kg/ m2)44. In our study also, 8.06% (n=10) of the overweight population and 6.67% (n=3) of the obese population had an instrumental vaginal delivery. Only one woman in the normal group (0.99%) had an instrumental delivery. This was a significant increase in the need for instrumental vaginal delivery in the overweight and obese groups (p=<0.001). This was not in agreement with Johnson et al who stated that obesity causes increased incidences of prolonged second stage and operative vaginal deliveries.
Duration of pregnancy
On analyzing the length of pregnancy, 83.27% (n=239) had a term delivery, 7.32% (n=21) had a preterm delivery (< 37 weeks) and the remaining 9.41% (n=27) had a prolonged pregnancy (>40 weeks). In our study, 11.76% (n=2) of underweight subjects had preterm delivery. Zhen Han et al. in a systematic review and meta-analyses, determined that singletons born to underweight women have higher risks of overall, spontaneous and induced PTB <37 weeks. The association between maternal underweight and PTB might be explained· by the fact that in developing countries, but less in the developed, there is likely a higher proportion of underweight women in the lower socioeconomic classes who are engaged in strenuous manual labour, or possibly have ethnic or genetic predisposition towards thinness and they lack nutrients resulting in diminished duration of gestation. On the other hand, 8.87% (n=11) and 8.89% (n=4) of the overweight and obese groups respectively had preterm deliveries. A recent systematic review of 14 studies demonstrated that prepregnancy obesity is associated with a 1.24-fold increased risk of PTB18. However, the mechanisms linking prepregnancy obesity with PTB are unclear. PTB is a heterogeneous condition. PTB can occur spontaneously following preterm labor or premature rupture of membranes or for medical indications. Furthermore, PTB can occur "early" (<34 weeks' gestation) or "late" (34-36 weeks' gestation). Pregnancy complications leading to medical inductions disproportionately contribute to late PTB, as compared to early PTB19. For example, severe hypertensive disorders of pregnancy are common among obese women and represent one of the most frequent medical indications for preterm delivery.
Additionally, some evidence 10 suggests that gestational diabetes, another common condition among obese women, is associate ith medically-induced and spontaneous preterm delivery. These findings all suggest potential mechanisms linking prepregnancy obesity with PTB. This suggests that a normal prepregnancy BMI is needed to have a normal term delivery. Any variations from the normal prepregnancy BMI, be it underweight, overweight or obese, increases the chance of Preterm deliveries. Increased term deliveries are seen in the normal group m our study - 86.14% (n=87). As the BMI varies from normal level, there is a decline in the term deliveries - 76.47% (n=13) in underweight group and 83.87% (n=104) and 77.78% (n=35) in overweight and obese groups. This trend is significant (p=0.012).
Naomi E. Stotland et al. by multivariable analysis, noticed that higher prepregnancy BMI was associated with higher risk of progressing past 40 weeks. Obese women had 69% higher adjusted odds of reaching 42 weeks' gestation, compared with women of normal prepregnancy BMI. The p value for the trend analysis of prepregnant BMI and prolonged pregnancy is (p=0.174) and therefore significant increase in prolonged pregnancy in obese groups is not seen in our study.
Birth weight
According to this study, 24.04% (n=69) of infants had low birth weight (<2.5kg), 39.72% (n=114) had a birth weight between 2.5-3kg, 27.18% (n=78) had birth weight between 3.0 - 3.5kg, 9.06% (n=26) had birth weight 3.5kg and above. When a correlation of birth weight and BMI according to the four BMI classes was studied, It was seen that 82.35% (n=l4) of women in the underweight group had birth weight less than 2.5 kg whereas only. 89% (n=4) in the obese group had low birth weight babies. On the other end of the spectrum, 24.44% (n=11) in obese group had birth weight more 3.5kg while there was no baby in the underweight group with weight more than 3Kg while in the normal BMI group there was one baby (0.99%). 53.47% (n=54) of the normal BMI population had babies with normal birth weight of 2.5 - 3kg whereas in overweight group 35.48% (n=44) had normal weight babies and even lesser in obese group women (28.89%; n=13). it was noted that lower BMI was significantly associated with low birth weight and as the BMI rises there was an increase in the birth weight of the baby (p=<0.001). Similar findings were noted with p<0.001 and p value 0.0009 for linear trend respectively where it was seen that the risk of macrosomia increased with increasing prepregnancy BMI.
APGAR scores
The average Apgar index at one minute after birth was 8.3 ± 1.7 and 8.9 ± 1.3 after five minutes. Our study failed to establish a significant correlation between Apgar score at one and five minutes (r=0.085, p <0.001; r=0.065, p<0.001). No significant differences were found between the BMI classes to Apgar values at one and five minutes after birth between all groups. 6 (2.11%) and 16 (16.14%) neonates had exceptionally low (<4) and low APGAR (5-7) score, respectively at 1st minute and only 2 (0.70 %) and 13 (4.56 %) neonates had very low (<4) and low APGAR (5- 7) score, respectively at 5th minute. Trend Chi square test showed that there was no significant effect of mat al overweight and obesity as risk factors of neonatal low Apgar score at 1st and 5th minute (p=0.281 and p=0.762 respectively). This corroborates with the results of Katie L Dickinson, B.S. et al who found in their study that Pre-pregnancy maternal BMI was not predictive of a poor first or second APGAR score (p=0.6669, p=0.7550). Our results were contradictory to the findings of others showed by Logistic regression analysis that maternal overweight [in odd ratio of 3.7, 95% CI 2.4-4.6] and obesity [in odd ratio of 13.4, 95 % CI 9.7-14.1] were risk factors of neonatal low APGAR scores. Sebire et al. [5] reported increased risk of low Apgar score for overweight and obese women.
NICU Stay
Rates of babies admitted to the neonatal intensive care unit were 43.75%, 11.88%, 15.45% and 33.33% in underweight, normal, overweight and obese groups respectively. P value is (p=0.034) and therefore shows a significant increase in NICU admission in both underweight and increasing BMI. Earlier studies report an increased risk for children from mothers with increased BMI to be admitted to neonatal care after birth. Children from underweight mothers are admitted to neonatal care due to preterm birth and subsequent IRDS which is a severe and life-threatening condition. On the other hand, children obese mothers are admitted because of an impaired glucose homeostasis, which requires surveillance. In our study we observed a significant association of overweight, obese, and underweight BMI with increased neonatal intensive care unit admission. Patricia Norwood et al1 07 at a population level study found that both high and low maternal BMI are associated with an increased risk of increased numbers of neonatal admissions.
Yu et al. suggest that the rapid fetal growth induced by maternal hyperinsulinemia coupled with placental insufficiency may result in the antepartum demise of the fetus in obese pregnant women. Indeed, this hypothesis has been corroborated by several epidemiological studies. In this study only 2 still births were found. In reality, there were too few women m the morbidly obese group to comment on this group's association with a rare outcome like stillbirth.
Some previous work has also demonstrated a strong link between postpartum blood loss and BMI. In our study, the risk of postpartum haemorrhage with increasing BMI was not significant. Other studies have reported conflicting results. While Sebire et al. [5] observed a 70% increase in postpartum haemorrhage, Bianco et al found no such difference in the incidence.
Recent reviews 109 on obesity and pregnancy have highlighted several issues relevant to research and management policy. Firstly, the lack of standard definitions of overweight and obesity makes comparison of findings acre, studies difficult. Some define obesity as an increased body mass index of greater than or equal to 30kg/m2, like in our study. Others have defined it as increased waist circumference, increased waist - hip ratio or body weight of more than 90 Kg. This makes comparison of studies difficult. Moreover, in most clinics, prepregnancy BMI is not recorded routinely, thereby making extrapolation of booking weight or women's recall of prepregnancy weight unreliable. Krishnamoorthy et al suggest that all pregnancies in obese women be acknowledged as high risk and managed according to strict guideline s. Management should include prepregnancy counselling to reduce weight.
In view of the above risks, the American College of Obstetricians and Gynecologists (ACOG) has recommended.
✓ Preconception counseling for obese women who are planning a pregnancy.
✓ BMI should be recorded for all women at the initial prenatal visit.Information concerning the maternal and fetal risks of obesity in pregnancy should be provided.
✓ Recommendations for appropriate weight gain, guided by IOM recommendations, should be reviewed both at the initial visit and periodically throughout pregnancy - Overweight women (BMI 25-29.9kg/ r.i, should be advised to gain no more than 7 - 11.5 kg during pregnancy, and obese women (BMI > 30kg/m2) no more than 5 - 9 kg during pregnancy.
✓ Obese women should be offered nutrition consultat ion, and they should be encouraged to follow an exercise program. This should be continued after delivery and before attempting another pregnancy.
✓ Lastly, breast feeding can help patients to lose the weight gained during pregnancy and may also have a small protective effect against childhood obesity.
This study demonstrates that women labeled overweight and obese at booking need to be considered as ' high risk ‘. Further research and clinical trials are needed in the field of obstetrics to contribute towards evidencebased care of obese women. This is an important area of interest, on which there are no national guidelines. The effect of maternal underweight on obstetric performance is less clear. While some researchers have found increased incidences of preterm delivery, low birth weight and increased perinatal loss in these women, others17 have reported a protective effect of maternal underweight on certain pregnancy complications and interventions. In our study low BMI in pregnant women was not seen to be associated with any major outcome [6-17].
Conclusion
Pre pregnancy body mass index plays a significant role in adverse pregnancy outcomes. In this study we correlated the association of prepregnancy BMI on various pregnancy outcomes. The study shows maternal BMI has strong associations with pregnancy complications and outcomes. Obesity is associated with increased incidence of preeclampsia , gestational diabetes mellitus, hypothyroidism , instrumental delivery, rates of induction of labour and caesarean delivery , increased birth weight. There is significant association of underweight BMI with anaemia and low 1h weight and preterm delivery. Underweight women appear to have better pregnancy outcomes than obese or overweight women. Our study results , taken together with existing literature, suggest an independent role of pre-pregnancy BMI as a determinant of adverse pregnancy outcomes.
Funding
No funding sources.
Ethical Approval
The study was approved by the Institutional Ethics Committee.
Conflict of Interest
The authors declare no conflict of interest.
Acknowledgements
The encouragement and support from Bharath Institute of Higher Education and Research, Chennai is gratefully acknowledged. For provided the laboratory facilities to carry out the research work.
References
- Abenhaim HA, Kinch RA, Morin L, et al. Effect of prepregnancy body mass index categories on obstetrical and neonatal outcomes. Arch Gynecol Obstet 2007; 275:39-43.
- Callaway LK, Prins JB, Chang AM, et al. The prevalence and impact of overweight and obesity in an Australian obstetric population. Med J Aust 2006; 184:56-59.
- Usha Kiran TS, Hemmadi S, Bethel J, et al. Outcome of pregnancy in a woman with an increased body mass index. BJOG 2005; 112:768 – 772.
- Metwally M, Ong KJ, Ledger WL, et al. Does high body mass index increase the risk of miscarriage after spontaneous and assisted conception? eta-analysis of the evidence. Fertil Steril 2008; 90:714-726.
- Sebire NJ, Jolly M, Harris J, et al. Is maternal underweight really a risk factor for adverse pregnancy outcome? A population-based study in London. Br J Obstetr Gynaecol 2001; 108:61-66.
- Han Z, Mulla S, Beyene J, et al. Maternal underweight and the risk of preterm birth and low birth weight: A systematic review and meta analyses. Int J Epidemiol 2011; 40:65-101
- Burguet A, Thiriez G, Mulin B, et al. Very preterm birth: should we be interested in maternal pre-pregnancy body mass index?. Arch Pediatr 2008; 15:1068-1075.
- Klein RZ, Haddow JE, Falx JD, et al. Prevalence of thyroid deficiency in pregnant women. Clin Endocrinol 1991; 35:41-46.
- Gayathri R, Lavanya S, Raghavan K. Subclinical hypothyroidism and autoimmune thyroiditis in pregnancy--A study in south Indian subjects. J Assoc Physicians India 2009; 57:691-63.
- Knudsen N, Laurberg P, Rasmussen LB, et al. Small differences in thyroid function may Be important for body mass index and the occurrence of obesity in the population. J Clin Endocrinol Metabolism 2005; 90:4019-4024.
- Institute of Medicine. Subcommittee on nutritional status and weight gain during pregnancy. Nutrition during pregnancy. Washington, DC: National Academy Press, 1990.
- Luke B, Hediger ML, Scholl TO. Point of diminishing returns: when does gestational weight gain cease benefiting birth weight and begin adding to maternal obesity? J Matern Fetal Med 1996; 5:168-73
- https://www.nap.edu/catalog/5071/wic-nutrition-risk-criteria-a-scientific-assessment
- http://publications.gc.ca/site/archivee-archived.html?url=http://publications.gc.ca/collections/collection_2011/sc-hc/H164-126-2010-eng.pdf
- Davis AJ. Preterm delivery tops infant causes of death. J Watch Women's Health 2006.
- Ehrenberg HM, Dierker L, Milluzzi C, et al. Low maternal weight, failure to thrive in pregnancy, and adverse pregnancy outcomes. Am J Obstetr Gynecol 2003; 189:1726-1730.
- https://www.gums.ac.ir/Upload/Modules/Contents/asset39/williams23.pdf
Author Info
Blessy David, E Chandra and K Vani*
Department of Obstetrics and Gynecology, Sree Balaji Medical College & Hospital Affiliated to Bharath Institute of Higher Education and Research, Chennai, Tamil Nadu, IndiaCitation: Blessy David, E Chandra, K Vani, Correlation of the Pre-Pregnancy BMI with the Neonatal Outcomes, J Res Med Dent Sci, 2021, 9 (5):188-199.
Received: 22-Apr-2021 Accepted: 20-May-2021 Published: 31-May-2021
