Research - (2022) Volume 10, Issue 3
Evaluation of Portals Field Size on Radiation therapy Linear Accelerator machine using Megavoltage Images
*Correspondence: Tariq Alqahtani, Department of Medical Equipments Technology, College of Applied medical Science, Majmaah University, Majmaah, 11952, Saudi Arabia, Email:
Abstract
The ultimate objective of this research was to automate methodologies of vision to monitor the presence of radioactive environments and lights. Any foil scanned with a digital scanner for linear accelerator equipment must be scanned using the MATLAB image processing program in order to determine the consistency of light and radiation fields. The scanned image is stored in the DICOM format as dataset while maintaining the image quality. In the megavoltage films analyzed in the fields of light and radiation, the upper, lower, right, and left borders are included. Accordingly, the physicist (10.2 ± 0.12 x 10.2 ± 0.01 cm) and the computerized field score (9.9 ± 0.36049 X 9.9 cm) and the physicist (9.9 ± 0.36 x 9.9 ± 0.11 cm) were the calculated field score (10.0 X 10.1 cm) by the mat laboratory. It showed that Matt Lab calculated the average illumination field size and where I was shown on the data, respectively. The computer score process cannot be distressed by sound, but it can now create certain small areas in relatively fast pictures that are quite necessary. Rather, these specifics were missed in a manual method in order to concentrate only on expected constraints that they found to be inappropriate.
Keywords
Portals, Field Size, Radiation therapy, Linear Accelerator
Introduction
This enables a digital picture to delete or correct the data generated by the original exposure. When generating the picture, the DR panel displays various gray values. That's considered a system of loyalty. It needs to be just as faithful to the system. This product is retained as raw data and is the basis for the processing of the imager. Several techniques can be used to improve the image representation of the human viewer and ensure maximum readability through testing, such as histogram analysis and exposure control. Formal radiography is essential for the optimal stage of the radiation level and quantity of the patient. This makes it possible to evolve irradiation, creating an unbelievable perspective on contradiction and altitude. The light number will be controlled by a change of seconds (mAs). At a given time, this refers to the number of X-rays. The performance of the Ray tube is defined in kV by kilovoltage (voltage/potential difference). This scheme, through that. Energy from ray beams is essential for contrast and size (its penetrative power). The map of radiation represents the structure of the patient. The image is not visible during this phase. A patient plan operates with the metro picture system shedding light on it. The more light is generated, and the recording system reaches the degree of light expression. The radiation map of the body is transformed into an apparent monochrome image (gray scale). For radiotherapy, the verification of light and radiation fields is vital. The position of such beams and light fields on the gate shall be checked at the time of receipt of the process portal by comparing the position of the radiation image, consisting of images taken by simulators or of reconstructed radiography. The (DRR). The quality of consistent radiation therapy is vital in order to design a properly automated, dedicated radiation test method on the treatment website. When improving location accuracy, better dosage coefficients can be taken into consideration, excluding overtime (Jones et.al, 1994). The analysis of the physics of radiotherapy in radiographic images has a long history. Used most successfully during electron beam quality control and measurement. Radiochrome film theorecinoma has been used for radiotherapy in physics over the past decade. The film is more tissue-like than an x-ray film, with increasing dosimetry of photon beams. In order to evaluate the film's darkening and link its darkening to radiation, a film dosimetry densitometer is also necessary. Compared to conventional radiographic films, several radiochrome film densitometers were used because the absorption levels for these different films appear at different wavelengths. For a qualified physicist, aligning photon fields can be a more complicated procedure. To detect and solve the problem, any misallocation should be evaluated for its magnitude, treatment effect, and need for biomedical engineering. Automatic evaluation of images involves detecting differences in the subject under inspection from the usual configuration. Two main problems are involved in the task: the way to distinguish the fragmentation power of the image, which is relatively sound-sensitive due to the nature of X-ray images; and, secondly, the algorithm needs to work very quickly to meet industrial requirements. A compromise between efficiency and reliability, on the one hand, and handling time, on the other hand, should be the definition of the segmentation algorithm. In the field of radiotherapy physics, certain specific conditions, such as quality controls, must be taken into consideration when applying imaging methods. Although images in the gray region generally have sharp edges, lower noise levels and a relatively high proportion of homogeneous values, X-ray images have somewhat loud damage, very rough-cutting effects due to squeezed radiation, and the object to be tested is very large, homogeneous, and highly dependent overlay areas. Therefore, it is necessary to evaluate certain variations and deficiencies, such as defects, pores, or gaps, which in relatively different noise regions can be interpreted as impulse noise. The majority of edge identification techniques typically used in computer vision were checked by previous researchers to examine radiation field limits. A two-phase process between the threshold for the histogram and the operator of Sobel [1-10].
Materials and Methods
The MATLAB image processing program is then used to treat every film scanned with a radiation scanner and to determine the length and consistency of the field of light and radiation. The scanned image is saved in the TIFF format in order to maintain the image quality. The upper, lower, right, and left limits of the light field for the film and megavoltage radiation field must be included in the analysed evidence. The researchers are subjective and record the control film by putting a prepared package of direct exposure films on a table outside the control film (SAD). Set at 0 degrees and marked with a rulerfitting object or a pen with sufficient pressure on a column band that crushed the jacket emulsion, a 10cm square collar ledger field. Typically, around 1 in the linear range of the curve in order to obtain optical density. Then, for 1-2 minutes, the movie was posted. The other two exposures should be displayed at a collision angle of +90 degrees with new faces from a single film or any other film. The record is being processed in an automotive high-speed processor. The goal was to demonstrate the collimator's vertical rotation axes and the collimator to address the nursing table of the patient and the isocentre document at the nominal distance associated with the daily dosage. This diagram demonstrates the position of the collimator on its axis. The crucible image of the project should be on the same axis and should not vary by more than one million meters when the collimator scales across its entire range of motion. Symmetrical opening and closing images of the jaws are anticipated around this point. The symmetry of all the collimator jaws should be slightly better than 1 mm at the cardinal angle at this stage of imaging. Now medical physicist can check coherence for luminous colours and fields of radiation. A prepared film pack perpendicular to the rotational axis of the collimator has been configured. In the corners of the light field, the ends of the light area are characterized by an opaque or pinhole in the ready film. The foil is positioned with the minimum zmax on the top of the film and the OD is drawn between 1 and 2 mm. In the centre, the convergences between light and radiation fields were examined, and a new interpretation was provided in the Mat laboratories. The analyst calculated that in the analysed data, the top, bottom, right and left light and radiation fields were included. The Chi Square test is used by the SPSS to measure, using data analysed on the windows, the significant difference between the doctor's score and the automatic score (Figure 1).
Results
These tables included the size of the field, light, radiation, and penumbra, which were evaluated objectively and subjectively in the computer program by the medical doctor (MATLAB). In this review, the type of radiation and light fields were addressed. The findings are presented in the tables and figures below, including the size of the light field, the size of the manual field, and the computer score. In this research, the T-test was carried out for all score variations (Figures 2 to Figure 6). The p values have been calculated in order to indicate whether all light size and radiation field variations are working on these effects. i.e.
P-value >0.05 no significance.
P-value <0.05 significant.
Discussion
It could be periodically checked by a trained medical physicist once contracted in a light and radiation field. Using the ready pack films for the lens, the edges of the light field were labeled with a light or pin hole at the edges of the field. From an emergency position. To produce an OD between 1 and 2 that is closest to zmax, place plastic on top of the film, and then irradiate it. Within 2 mm, the edge of the light field is called the edge of the radiation field. In order to prove the current dimensions of the virtual light and photon source at the same distance, this test is repeated over a wide variety of field sizes across a different range of distances. At this stage, the field of light was aligned with the axis of the rotating collimator. They have also provided accurate characteristics through application. The human eyes, especially in the case of radiography, didn't really see so accurately because the human eye simplifies the image analysis process, but a computer is better and more accurate. Furthermore, for automatic inspections, the gray scale at the edge of the radiator field image is slightly different from the outside of the field. The fields are 10 x 10 cm, instead of 9.9 to 9.9 cm. The typical ± 2 mm range, which is typically a defined mistake, is also derived from such a variation. The t-test demonstrated that the actual value differed substantially from the manual for the field size (true value). For medical physicists, normal radiation field scores due to the presence of a penumbra darkening the field edge of the brand region indicate a slight increase in medical physicists' level of radiation field reading. Computer-initialized issues with the process have arisen even under very complex conditions in portal pictures. The sound would still confuse the computer score technology for relatively easy images and cause a few smaller parts to be further processed. In its manual operation, such details were, however, ignored in order to concentrate only on expected limits that were found to be incorrect. Figures and tables 1-4 discover the distinction between the two techniques. In Figure 1, the original image was presented in a single column using an automatic method and a manual approach for better viewing of the result. Only the sectional display of the relevant areas was designed for the range. The whole image was, however, divided. Several instances in which manual technology failed for two reasons are provided in Figures 2-3. According to Figure 1, no manual valid (borderfelt difficult detection) results could be identified for various filter types, such as multiple filtering grades including: (Border)) improving contrast, solution and reduced noise (Median, Roberts and Sobel filters). Qualitatively, the results of segmentation were considered acceptable as the limits detected were close to the expected limits. Because the photographs were complex, the manual score principle collapsed. Although there has been no acceptance of only one visible appearance, the results of the computerized approach are appropriate. This vision was recognized as the last difficulty, even for the human eye, from the beginning. Based on an automatic procedure which identifies radiation fields in terms of both the segmentation results and the calculation time, the IT method was much more robust. To measure objective photon field alignment, seen from the naked eyes of some megavoltage machines, the MATLAB program was used. The electronic test program was based on information from a general image of the company. When the fields of interest (i.e., the field borders and the central regions) were clearly defined, it was effective because and other studies, the different fields in the image could be separated by effective computer scoring. However, because density variations were more significant for these regions compared to the regions between them, this technique could not properly identify a grid. By comparison, to determine where the curve was next, the computerized method is used based on local gradient data [11-18]. Therefore, using an initial shape near the border, the difference in density within the area was addressed. However, if the initial front of the diffuse points were found and more of the data collected were used within the processed area, the method would in particular be able to determine some of the overall data conditions affected by the locale thresholding tool.
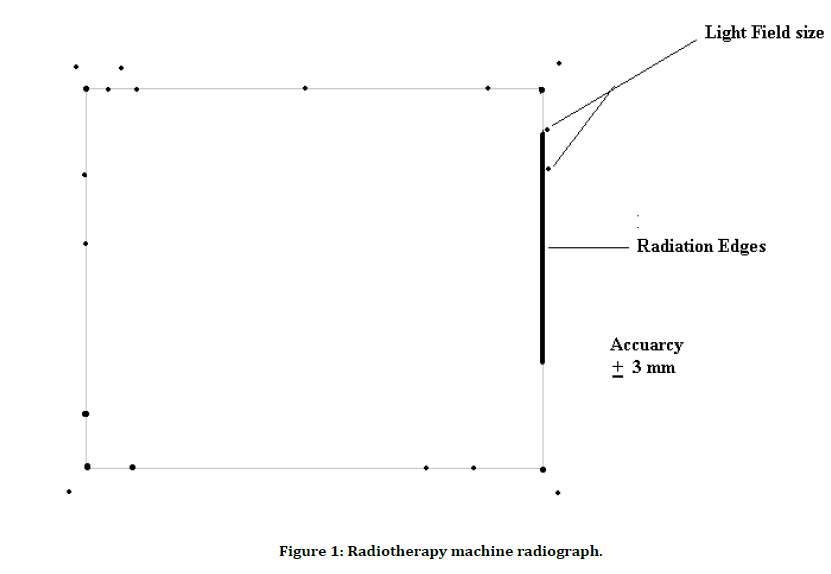
Figure 1: Radiotherapy machine radiograph.
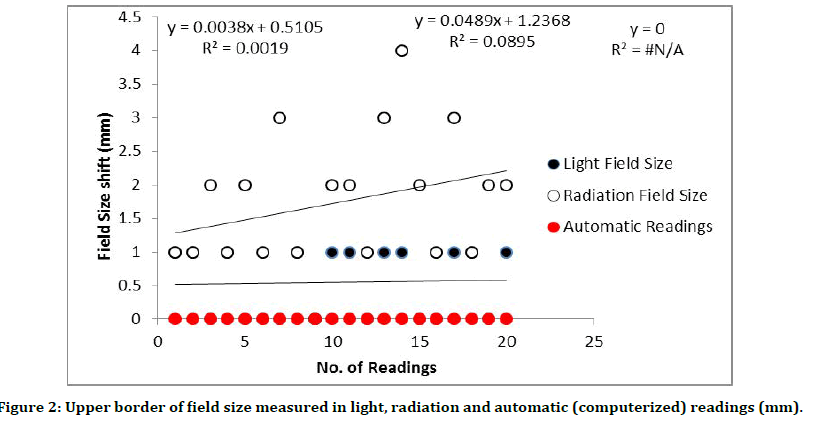
Figure 2:Upper border of field size measured in light, radiation and automatic (computerized) readings (mm).
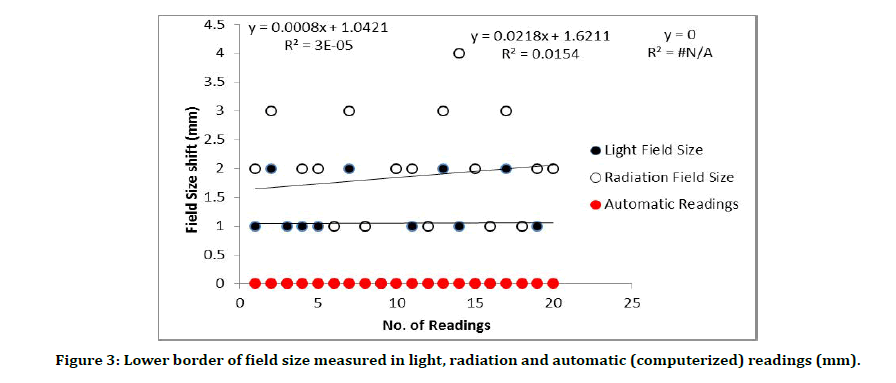
Figure 3:Lower border of field size measured in light, radiation and automatic (computerized) readings (mm).
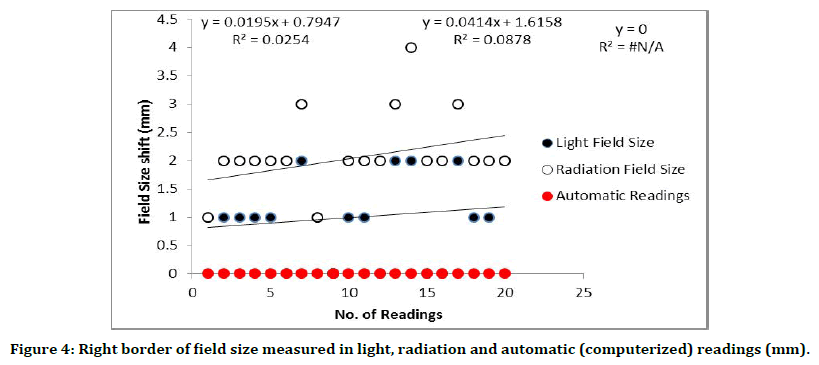
Figure 4:Right border of field size measured in light, radiation and automatic (computerized) readings (mm).
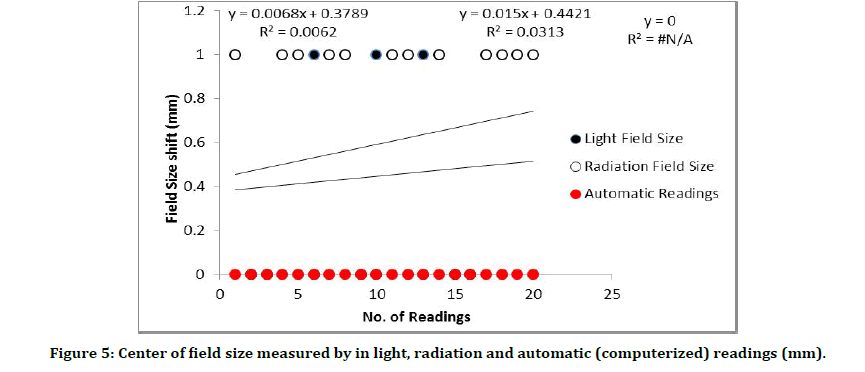
Figure 5:Center of field size measured by in light, radiation and automatic (computerized) readings (mm).
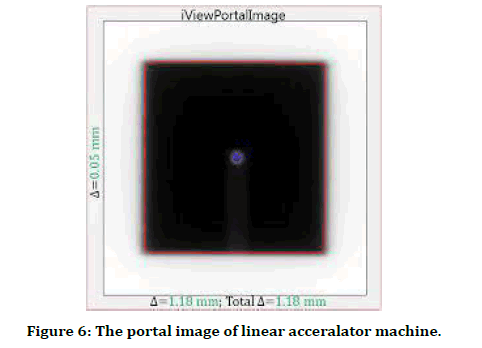
Figure 6:The portal image of linear acceralator machine.
References
- Budgell GJ, Zhang R, Mackay RI. Daily monitoring of linear accelerator beam parameters using an amorphous silicon EPID. Phys Med Biol 2007; 52:1721.
- Sun B, Goddu SM, Yaddanapudi S, et al. Daily QA of linear accelerators using only EPID and OBI. Med Phys 2015; 42:5584–94.
- Kang D, Deng X, Huang S. Quality control for multileaf collimator leaf position accuracy using amorphous silicon electronic portal imaging devices. Ai Zheng 2009; 28:771–774.
- Sumida I, Yamaguchi H, Kizaki H, et al. Quality assurance of MLC leaf position accuracy and relative dose effect at the MLC abutment region using an electronic portal imaging device. J Radiat Res 2012; 38.
- Celi S, Costa E, Wessels C, et al. EPID based in vivo dosimetry system: Clinical experience and results. J Appl Clin Med Phys 2016; 17.
- Mijnheer B, Olaciregui-Ruiz I, Rozendaal R, et al. Current status of 3D EPID-based in vivo dosimetry in the Netherlands cancer institute. J Phys Conf Ser 2015.
- Almond PR, Biggs PJ, Coursey BM, et al. AAPM’s TG-51 protocol for clinical reference dosimetry of high-energy photon and electron beams. Med Phys 1999; 26:1847–70.
- Herman MG, Balter JM, Jaffray DA, et al. Clinical use of electronic portal imaging: Report of AAPM radiation therapy committee task group 58. Med Phys 2001; 28:712–737.
- Kavuma A, Glegg M, Currie G, et al. Assessment of dosimetrical performance in 11 Varian a-Si500 electronic portal imaging devices. Phys Med Biol 2008; 53:6893.
- Commission IE. Medical electrical equipment: Medical electron accelerators-functional performance characteristics. Int Elect Commission 1989.
- Halabi T, Faddegon B. Practical quantitative measurement of graticule misalignment relative to collimator axis of rotation. J Appl Clin Med Phys 2010; 11.
- Klein EE, Hanley J, Bayouth J, et al. Task group 142 report: Quality assurance of medical accelerators. Med Physb2009; 36:4197–212.
- Grz ̨adziel A, Smoli ́nska B, Rutkowski R, ́et al. EPID dosimetry configuration and pre-treatment IMRT verification. Rep Pract Oncol Radiother 2007; 12:307–312.
- Sukumar P, Padmanaban S, Jeevanandam P, et al. A study on dosimetric properties of electronic portal imaging device and its use as a quality assurance tool in volumetric modulated arc therapy. Rep Pract Oncol Radiother 2011; 16:248–55.
- Winkler P, Hefner A, Georg D. Implementation and validation of portal dosimetry with an amorphous silicon EPID in the energy range from 6 to 25 MV. Phys Med Biol 2007; 52:N355.
- Tyler M, Vial P, Metcalfe P, et al. Clinical validation of an in-house EPID dosimetry system for IMRT QA at the Prince of Wales Hospital. J Phys: Conf Ser 2013.
- Greer PB, Popescu CC. Dosimetric properties of an amorphous silicon electronic portal imaging device for verification of dynamic intensity modulated radiation therapy. Med Phys 2003; 30:1618–1627.
- Fredh A, Korreman S, af Rosenschöld PM. Automated analysis of images acquired with electronic portal imaging device during delivery of quality assurance plans for inversely optimized arc therapy. Radiother Oncol 2010; 94:195–198.
Indexed at, Google Scholar, Cross Ref
Indexed at, Google Scholar, Cross Ref
Indexed at, Google Scholar, Cross Ref
Indexed at, Google Scholar, Cross Ref
Indexed at, Google Scholar, Cross Ref
Indexed at, Google Scholar, Cross Ref
Indexed at, Google Scholar, Cross Ref
Indexed at, Google Scholar, Cross Ref
Indexed at, Google Scholar, Cross Ref
Indexed at, Google Scholar, Cross Ref
Indexed at, Google Scholar, Cross Ref
Indexed at, Google Scholar, Cross Ref
Indexed at, Google Scholar, Cross Ref
Indexed at, Google Scholar, Cross Ref
Indexed at, Google Scholar, Cross Ref
Indexed at, Google Scholar, Cross Ref
Author Info
Department of Medical Equipments Technology, College of Applied medical Science, Majmaah University, Majmaah, 11952, Saudi ArabiaCitation: Tariq Alqahtani, Evaluation of Portals Field Size on Radiation therapy Linear Accelerator machine using Megavoltage Images, J Res Med Dent Sci, 2022, 10 (3):103-108.
Received: 04-Mar-2022, Manuscript No. JRMDS-22-57443; , Pre QC No. JRMDS-22-57443 (PQ); Editor assigned: 07-Feb-2022, Pre QC No. JRMDS-22-57443 (PQ); Reviewed: 21-Mar-2022, QC No. JRMDS-22-57443; Revised: 25-Mar-2022, Manuscript No. JRMDS-22-57443(R); Published: 31-Mar-2022
