Research Article - (2022) Volume 10, Issue 8
Influence of Simulated Gastric Juice on Surface Roughness, Morphology and Micro Hardness of CAD-CAM Materials (An In Vitro Study)
Ghadeer S Abdulameer* and Mohammed R Hameed
*Correspondence: Ghadeer S Abdulameer, Department of Restorative and Esthetic Dentistry, College of Dentistry, Baghdad University, Iraq, Email:
Abstract
Aim: The objective of this in vitro study was to evaluate the effect of the simulated gastric acid on surface roughness, morphology and micro hardness of CAD/CAM ceramics and comparable with the immersion in the artificial saliva.
Materials and methods: A total of 160 sample were prepared (80 were observed for micro hardness with Vickers micro hardness testing machine and the other 80 were observed for roughness with profile meter testing machine and surface morphology changes with field emission scanning electron microscope). Each 80 samples were divided into two categories, with 40 each. Category I (made of IPS e.max CAD) and Category II (made of CEREC blocs C PC). The specimens (3 mm thickness, n=10) were cut, sintered, polished, glazed and cleaned before immersed in artificial saliva and simulated gastric acid solution. Vickers micro hardness, surface roughness and surface morphology evaluations were taken before (baseline) and after immersion.
Results: Paired t-test showed significant an increase of surface roughness for IPS e. max (glazed and without glazed) after immersion in simulated gastric acid while there was significant decrease in surface roughness for CEREC blocs C PC (glazed and without glazed) in the same acid. P value was not significant change for all groups when immersed in artificial saliva. The micro hardness decrease after immersion in both artificial saliva and gastric acid for all groups with no significant in saliva but with significant in gastric acid and larger variability.
Keywords: IPS e.max CAD, CEREC blocs CPC, Gastric acid, Surface roughness, Morphology, Vickers Micro hardness
Introduction
Loss of tooth surface may be due to four main reasons: (erosion, abrasion, attrition and abfraction). Dental erosion is defined “as the irreversible loss of tooth structure through dissolution by acid due to non-bacterial causes”. In the recent years dental erosion has become a topic of interest in general dentistry regarding its causes, diagnosis, and management [1,2].
The repeated acid attacks making the tooth surface to be more susceptible to abrasive wear, thus the term “erosive tooth wear” was coined. The origin of these erosive acids can be intrinsic such as stomach acids or extrinsic origin as in acidic beverages and food. The PH and erosive ability of gastric acid is significantly more than dietary acids, thus the level of destruction of tooth structure is generally more sever. The gastric acids reach to the oral cavity through vomiting or regurgitation [3].
Eating disorders such as anorexia and bulimia nervosa are well known etiologic factors in the progress of dental erosion. While regurgitation defined as involuntary movement of the gastric juice from the stomach into the oral cavity, has also been known as a common cause of sever dental erosion [4].
Gastoesophageal Reflux Disease (GERD) is a common medical condition causing involuntary movement of gastric acid into the mouth. It has been reported that 10–20% of the population suffers from gastroesophageal reflux. The correlation between dental erosion and GERD is either presented as patients with GERD who are then have dental erosion and patients with dental erosion having GERD. A systematic review by pace et al. reported the prevalence of erosion in GERD patients as 24% and that about 33% of patients with dental erosion have GERD [5].
The PH of the gastric acid is very low (<2.0) which is lower than the critical PH of enamel (5.5), thus more erosive damage to the tooth surface. Sufficient salivary flow and salivary buffering ability acts as antagonists to acid attacks. GERD is an involuntary response not coordinated by the autonomic nervous system. Therefore, there may be insufficient time for saliva to act before erosion occurs [6].
Restoration eroder tooth structure can be executed with either direct or indirect restoration. Only few studies in the literature have focused on the behaviour of such restorations under acidic and erosive conditions. Chemical degradation of dental ceramics can lead to decrease ceramics hardness and increased surface roughness, which may further promote abrasion of the opposing dentition, increase plaque accumulation and possibly release harmful elements from the ceramics. Increased surface roughness may also cause stress concentrations to the material and provocative crack initiation and propagation [7].
Materials and Methods
Ceramic samples preparation
A total of 160 sample were prepared (80 were observed for micro hardness with Vickers micro hardness testing machine and the other 80 were observed for roughness with profile meter testing machine and surface morphology changes with scanning electron microscope). Each 80 samples were divided into two categories, with 40 each. According to the type of the ceramic materials used: Category I (made of IPS e.max CAD) and Category II (made of CEREC blocs C PC). Each category was divided into two groups, Containing 20 samples each:
- Group A: IPS e.max CAD treated by polishing and
- Group B: IPS e.max CAD treated with glazing.
- Group C: CEREC blocs C PC treated by polishing and
- Group D: CEREC blocs C PC treated with glazing.
Which was subdivided into two subgroups each containing 10 samples (A1, B1, C1 and D1) act as control group immersed in artificial saliva and (A2, B2, C2 and D2) immersed in simulated gastric acid.
The sizes of the CEREC blocs CPC (Sirona Dental, Germany) and IPS e.max (Ivoclar/Vivadent, Liechtenstein Germany) were 12 × 14 × 18 mm and 12.4 × 14.5 × 18 mm respectively. The ceramic blocs were cut into slices of 3 mm in thickness; the cutting time was 10 min. for each slice.
Samples made from IPS e. max CAD are in a pre-crystallization state and still bluish in colour, therefore a crystallization firing process were carried out using a ceramic firing furnace to impart the glass-ceramic samples with their final strength and esthetic properties. For the ceramic CEREC blocsc C PC, the samples were undergoing a glazing and firing processes in which the samples were first sprayed with the CEREC Speed Glaze spray.
The surface of polished samples were polished using the grinder/polisher machine (MoPao 160E Metallographic Specimen Grinding and Polishing Machine, China) in which each sample was polished in three steps, a silicon carbide paper with a grit size of (600, 1200, 1500) were used with rotational speed of 220 rpm under water cooling for 2 minute using a special design metal holder to provide a uniform pressure during polishing for all the samples.
All analyses were carried out before and after artificial saliva and gastric acidic challenge. Specimens were individually immersed for 18 hours and 25 minutes in 3 mL of simulated gastric juice. The simulated gastric juice was prepared with 0.113% Hydrochloric Acid (HCl) solution in deionized water and adjusted to pH 1.28. The immersion time corresponded to 2 years of gastric juice exposure, considering that on average patients with bulimia purge 3 times daily 9 and the estimated contact time of the gastric juice with restorations is 30 seconds [10,11].
Surface roughnss measurement
The surface roughness (Ra) was measured using a stylus profile meter (Pocket Surf IV Portable Surface Roughness Gage, MAHR GMBH, Germany) which scans surface roughness with 5 µm-diameter diamond stylus and 90º tip angle. To measure the roughness profile (Ra) value in micro meters (µm), the tracing diamond stylus was moved across the surface (backward and forward) under a constant load of 4 mN (measuring force) with a speed of 0.5 mm/sec and a cut-off value of 0.8 mm. Calibration was checked with a standard (Ra=2.94 µm) before the first use and after every 10 samples. Three traces were recorded for each ceramic disk which oriented consistently and measured at 3 different parallel locations to determine 3 Ra for each disk. Then the mean surface roughness measurement was calculated for each ceramic disk (average value) to be used later in the statistical analysis.
Surface hardness measurements
Hardness was determined using the indentation technique with a micro hardness tester (Digital Micro Vickers Hardness Tester TH714 Images, china) under a load of 500 g for 15 s. Three indentations were made on each specimen using a Vickers diamond indenter to determine the mean micro hardness value for each specimen. Indentation dimensions were measured using the eyepiece of a microscope, and hardness values were obtained from standard tables.
Morphological assessment of surface topography
Specimens from each group were randomly selected for morphological assessment using a scanning electron microscope. The selected specimens were thoroughly cleaned, rinsed with distilled water for 5 minutes, dried, and fixed onto an aluminium mount and lightly sputtered with a gold-palladium alloy (SPI Module sputter; SPI Supplies, West Chester, PA). The surface topography of the specimens was imaged using Scanning Electron Microscopy (SEM) (INSPECT F50 Field Emission Scanning Electron Microscope; FEI, Hillsboro, US). FE SEM micrographs were taken at 5000x, 25000x and 50000x magnifications.
Statistical Analysis
Data description, analysis and presentation were performed using Statistical Package for social Science (SPSS version-26, Chicago, Illionis, USA).
Shapiro Wilk test: test the normality distribution of the quantitative variable.
Levene test: test the homogeneity of the variance for the quantitative variable among groups.
Independent Sample T test: parametric test the difference between two groups and Paired t test: statistical test the difference between two related times or two measurements for two observers.
Level of significance as: Not significant P>0.05, Significant P<0.05.
Results
Surface roughness
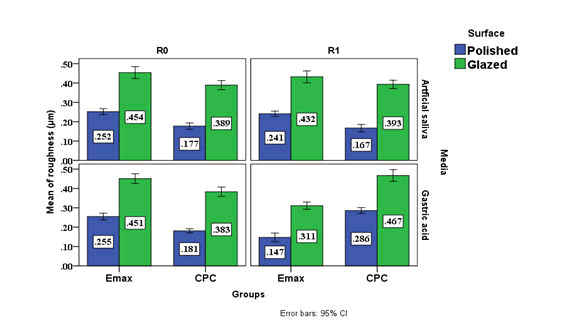
Paired t-test showed significant an increase of surface roughness for group A and B after immersion in simulated gastric acid while there was significant decrease in surface roughness for group C and D in the same acid. P value was not significant change for all groups when immersed in artificial saliva. The Effect Size (ES) show that the group B was the most effect group followed by the group C, A and D respectively as describe in the Table 1.
| Groups | Surface | Media | Before | After | |||||||||
|---|---|---|---|---|---|---|---|---|---|---|---|---|---|
| Min. | Max. | Mean | ± SD | Min. | Max. | Mean | ± SD | Paired t test | P value | ES | |||
| I | A | A1 | 0.22 | 0.29 | 0.252 | 0.022 | 0.22 | 0.28 | 0.24 | 0.02 | 1.718 | 0.240^ | 0.543 |
| A2 | 0.22 | 0.29 | 0.255 | 0.024 | 0.11 | 0.21 | 0.15 | 0.03 | 9.369 | 0.000* | 2.963 | ||
| B | B1 | 0.39 | 0.52 | 0.454 | 0.042 | 0.35 | 0.49 | 0.43 | 0.04 | 3.236 | 0.080^ | 0.734 | |
| B2 | 0.39 | 0.51 | 0.451 | 0.035 | 0.28 | 0.35 | 0.31 | 0.03 | 21.546 | 0.000* | 6.813 | ||
| II | C | C1 | 0.14 | 0.21 | 0.177 | 0.023 | 0.12 | 0.21 | 0.17 | 0.03 | 2.535 | 0.096^ | 0.7 |
| C2 | 0.16 | 0.21 | 0.181 | 0.015 | 0.25 | 0.31 | 0.29 | 0.02 | 20.125 | 0.000* | 6.364 | ||
| D | D1 | 0.33 | 0.44 | 0.389 | 0.033 | 0.35 | 0.45 | 0.39 | 0.03 | 0.768 | 0.462^ | 0.243 | |
| D2 | 0.33 | 0.43 | 0.383 | 0.034 | 0.39 | 0.53 | 0.47 | 0.04 | 8.381 | 0.000* | 2.65 | ||
Table 1: Descriptive and statistical test of surface roughness change among groups, surface and media before and after immersion indicating the data and P values after paired t-test.
Micro hardness
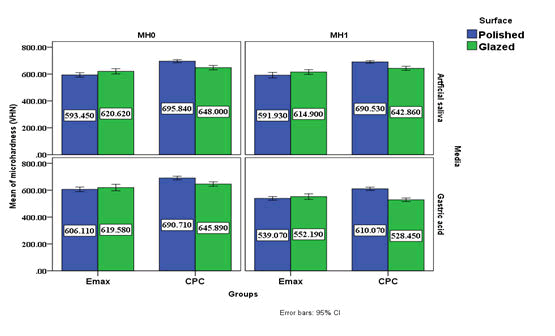
Results below in Table 2 show that micro hardness decrease after immersion in both artificial saliva and gastric acid for all groups with no significant in saliva and less variability but with significant in gastric acid and larger variability. And the ES show that the group D was the most effected group followed by group C, A and B groups respective (Table 2)
| Groups | Surface | Media | Before | After | Paired t test | P value | ES | ||||||
|---|---|---|---|---|---|---|---|---|---|---|---|---|---|
| Min. | Max. | Mean | ± SD | Min. | Max. | Mean | ± SD | ||||||
| I | A | A1 | 564.6 | 623.2 | 593.45 | 23.037 | 555.2 | 635.2 | 591.93 | 28.426 | 0.485 | 0.639 | 0.153 |
| A2 | 574.3 | 641.3 | 606.11 | 23.626 | 515.2 | 575.2 | 539.07 | 19.613 | 15.552 | 0 | 3.087 | ||
| B | B1 | 589.2 | 663.8 | 620.62 | 27.086 | 580.9 | 660.4 | 614.9 | 24.566 | 1.981 | 0.237 | 0.626 | |
| B2 | 569.1 | 664.1 | 619.58 | 33.606 | 502.3 | 597.2 | 552.19 | 28.838 | 11.077 | 0 | 2.152 | ||
| II | C | C1 | 671.9 | 720.5 | 695.84 | 15.758 | 675.1 | 710.1 | 690.53 | 13.029 | 1.955 | 0.237 | 0.618 |
| C2 | 652.1 | 711.2 | 690.71 | 18.595 | 570.9 | 622.5 | 610.07 | 16.872 | 18.225 | 0 | 4.543 | ||
| D | D1 | 620.5 | 683.2 | 648 | 22.673 | 614.6 | 668.4 | 642.86 | 21.121 | 2.964 | 0.064 | 0.937 | |
| D2 | 620.4 | 694.3 | 645.89 | 22.606 | 495.7 | 564.3 | 528.45 | 18.895 | 13.156 | 0 | 5.638 | ||
Table 2: Descriptive and statistical test of surface roughness change among groups, surface and media before and after immersion indicating the data and P values after paired t-test.
Scanning electron microscopy analysis
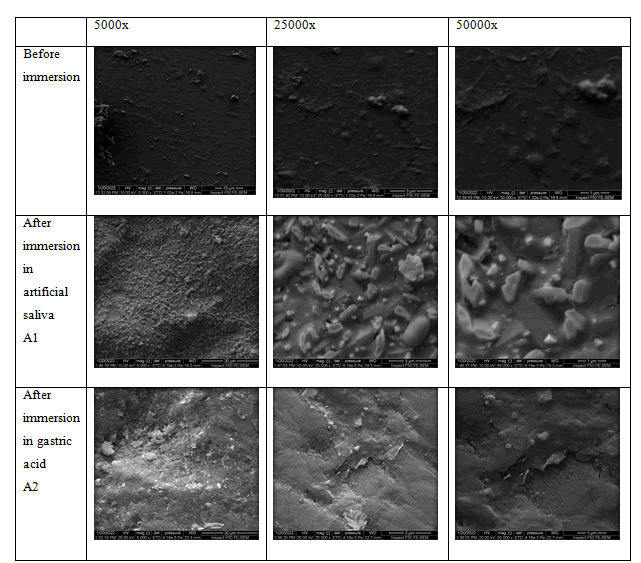
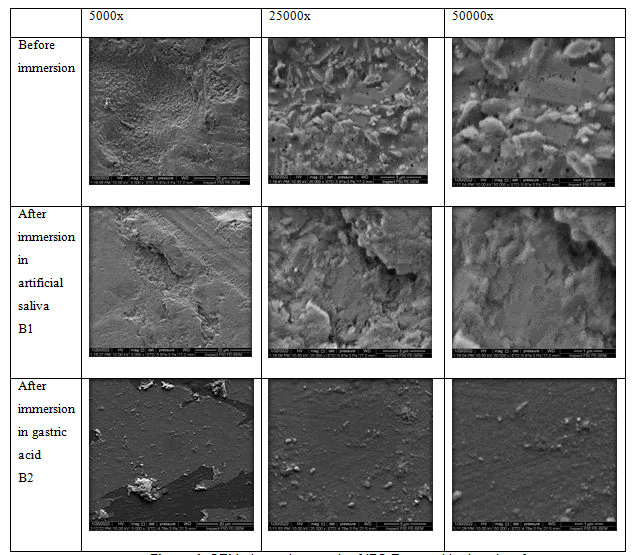
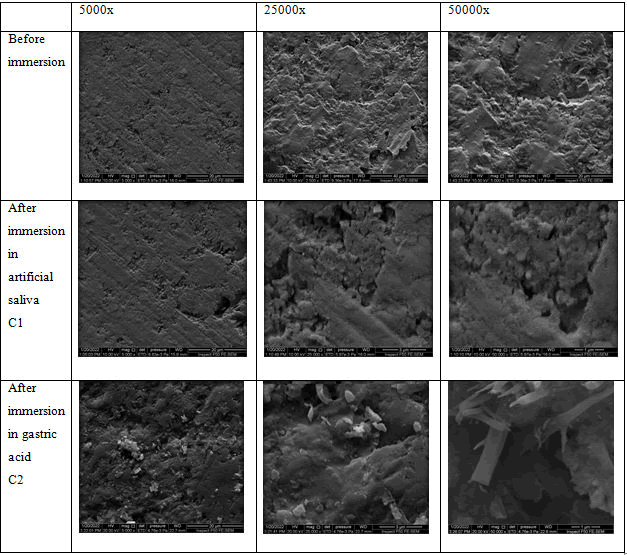
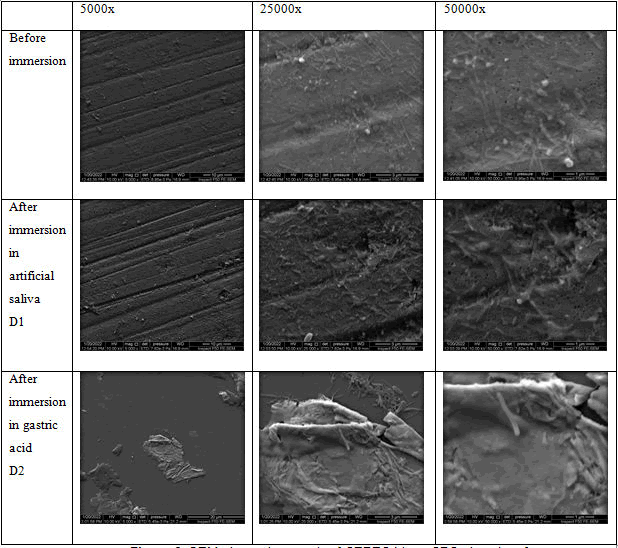
The results of the field emission scanning electron microscope showed in Figures 1-6.
Figure 1: Cluster chart bars showing the mean values of the surface roughness of different groups.
Figure 2: Cluster chart bars showing the mean values of the Vickers micro hardness values of different groups.
Figure 3: SEM photomicrograph of IPS E.max polished surface.
Figure 4: SEM photomicrograph of IPS e.max with glazed surface.
Figure 5: SEM photomicrograph of CEREC blocs CPC polished.
Figure 6: SEM photomicrograph of CEREC blocs CPC glazed surface.
Discussion
The ultimate objective of restorative dentistry is to replace lost tooth structure with a material whose physical properties and mechanical performance are similar to that of natural teeth. All dental restorations are exposed to complex and varying oral conditions during their service life
Dental professionals usually review medical histories and medications that identify patients with a diagnosis of acid reflux. Most often, a specialized physician known as a gastroenterologist treats this condition. However, there are dental manifestations to Gastoesophageal Reflux Disease (GERD), so it is important that dental professionals identify these patients and recommend appropriate dental treatment to maintain a long-term health of the dentition. Furthermore, dental professionals could recognize this condition in untreated patients and may need to refer those patients to a specialist for further evaluation.
One of the most challenging tasks for a restorative dentist is to esthetically match natural teeth and surrounding tissues, due to so many variations in colour and shape of natural teeth [12, 13]. In general, ceramics with an increased proportion of glassy matrix, like feldspathic porcelain and lithium desilicated ceramics, have superior esthetic properties compared to more opaque highly crystalline ceramics like zirconia so in this study the feldspar CRERC blocs CPC and Lithium desilicated IPS e.max CAD were used, which represents the mostly used CAD/CAM ceramic materials clinically and further investigations required concerning the mechanical behaviour in the present of acidic media and compared with the artificial saliva. Ceramic restorations can be finished by surface polishing or by the application of a glaze layer [14]. The glaze technique consists of the use of a thermally compatible low melting glass layer on the ceramic surface, which is the most popular surface coating procedure for ceramic restorations [15].
Although the glaze layer decreases surface roughness, its effect on the durability of restorations in the oral environment remains unclear [16]. A previous study has shown that the glaze layer exhibits surface degradation when exposed to pH variations [7]. Also, chemical and mechanical degradation of the glaze layer can increase surface roughness, which could lead to biofilm accumulation, as bacteria get entrapped in the surface irregularities [17].
Half of the ceramic materials were just polished then tested without glazing to determine the effect of gastric acid on the ceramic material itself, as the glaze layer is removed or peeled off after about six months [18]. Furthermore, during the final adjustment of the restorations better to do polishing rather than reglazing and several studies have shown that polishing methods can result in a final ceramic surface with a similar or better roughness than glaze-fired ceramic surfaces [19].
In an in vitro study, the specimens were immersed in two different media the first was the artificial saliva which acts as the control media as same as the normal patient without any gastroesophageal reflux disease. And the second media was the simulated gastric acid which replicates the GERD patients or any other patients with gastroesophageal disorders.
The risk of these acids lies in its chelating effect that can cause degradation, ionic dissolution and release of alkaline lithium and aluminium ions, which are less stable in the glassy phase than in the crystalline phases, and results in the dissolution of the ceramic silicate network, which can be toxic. Resistance to chemical degradation of dental materials is a principal requirement for intra-oral use and is a relevant concern in choosing ceramic materials for restorations. Dental prostheses must resist degradation over both intermittent and constant exposure to hard conditions arising from temperature changes and acid-based shifts [20].
However, information considering the degradation of the recently developed materials under variation in pH conditions is limited. Hence, this study was designed to investigate the effects of acidic environment and low pH on surface roughness, micro hardness and surface morphology of different ceramic materials.
Surface roughness: Although the materials were subjected to the same polishing protocol and glazing as manufacture for each material, significant differences in roughness were found among them as follows:
Lithium discilicate: The polished and glazed surfaces of IPS e.max CAD evaluated in the present study showed a significant reduction in the surface roughness after acid exposure, which exerted a very high effect size on this property.
In regard the polishing surface, the lower roughness of IPS e.max CAD was also reported by Mormann and can be attributed to microstructural differences [21-23].
Sulaiman and Kulkarni reported a significant increase in roughness after gastric acidic challenge for IPS e.max CAD, which was not found in the present study [2,12]. According to Sulaiman the glassy matrix of the lithium disilicate glass ceramic dissolves more quickly than the crystalline grains, resulting in a rougher surface. However, in another study the erosive pattern exhibited by the IPS e.max CAD when exposed to hydrochloric acid up to the equivalent of 1 year led the authors to hypothesize those longer periods of exposure would result in a smoother material compared with the baseline, which is consistent with the present study. Presumably, the superficial glassy matrix is removed initially, exposing the crystalline phase, which begins to undergo acid attack, reducing the surface roughness. Ramos reported a Based on other studies [23-26] that evaluated the microstructure of this material; it can be assumed that the acid dissolved the lithium silicate glassy matrix, revealing the fine crystalline structure with a mean crystal size of 500 nm to 1.5 µm, considerably smaller than that of the lithium disilicate crystals. The SEM images show that acid exposure created several pores of nanometre size. These processes after acid exposure involved loss or dissolution of their components; this was not confirmed by the mass analysis.
The surface roughness (Ra) decreased after the application of the glaze layer over ceramic materials; however, glazed samples did not show lower results in comparison with the sintered surface. The glaze layer presented a surface marked by bubbles and pathways of brush application, generating an irregular and no uniform surface, as can be seen by SEM images. Regarding these findings, some authors have noted that polishing with abrasive rubbers and polishing pastes would be necessary to obtain a uniform surface on the glaze layer [14]. In this study, a significant reduction in the Ra value of the glaze layer, which agree with previous studies [2,12,27] indicating that these materials are susceptible to degradation in low pH environments. Besides that, SEM images showed a uniform glaze surface suggesting that layer dissolution took place during a uniformly continuous corrosive process. Furthermore, a previous study compared SEM images of the surfaces of lithium desilicated and a glaze. A more general dissolution was observed for the glaze layer in addition to a rougher topography for lithium desilicated. It is likely related to the release of crystals from the ceramic surface upon dissolution of the glassy phase, thereby increasing its surface roughness which disagrees with the present study. In contrast, the glaze surface is more uniform by generalized dissolution, as can be seen by the Ra results and the SEM images of the present study [17].
Feldspathic ceramic
The CEREC blocs C PC (polychromatic) type of feldspathic ceramic with several layers of colour was used in this study, the roughness Ra values of polished and glazed surfaces of CPC were increased.
Cruz reported a significant decrease in surface roughness after gastric acidic challenge for feldspathic ceramic, which was not found in the present study [11]. Feldspathic ceramic contains glassy matrix (86% wt) infiltrated with a low-viscosity copolymer (urethane dimethacrylate and triethylene glycol dimethacrylate) [28]. The increased in its roughness was possibly due to the dissolution of the glassy matrix portion that constitutes most of this material. The boundaries between the ceramic and polymer portions became more evident with the dissolution of the feldspathic matrix by the acid. Furthermore, micro cracks were observed on the surface, revealing that this material seems to have been the most affected by the acid [23,29].
Vickers micro hardness: Hardness is a measure of resistance to permanent indentation. The Vickers Micro Hardness (VHN) test quantifies the hardness and is measured according to the depth of indentation of a diamond pyramid [30]. The degradation of ceramics generally occurs because of mechanical factors or chemical attack. The possible physiologic side effects on ceramic materials due to this are their tendency to abrade opposing dental structures, emission of ions which may influence further degradation [31].
All the groups evaluated in the present study showed a significant reduction in the micro hardness after immersion in the gastric acid and not affected after immersion in the artificial saliva.
According to Junpoom the two mechanisms that are responsible for decrease in micro hardness are:
- Leaching of alkali ions
- Glass network dissolution,
And this mechanism is controlled by interchange of alkali ions and H+ ions, and H3O+ ions between glass and aqueous solution and is leached out [32]. The present study is supported by the study conducted by Kukiattrakoon [27,33]. Who evaluated different naturally occurring acidic agents on properties of dental ceramics and concluded that there was a significant decrease in micro hardness and also the weight percentages of silicon, potassium, aluminium, and sodium after immersion.
The results of the present study are supported by the studies conducted by Denry, Eleana and Vechiato-Filho [34-36].
Cruz reported that the simulated gastric juice did not affect the hardness of the materials and exerted a moderate effect size. This finding is consistent with the study by Backer [4,11]. The authors are unaware of studies that evaluated the other CAD-CAM monolithic materials with a similar methodology. Unlike the acid exposure, the material was more decisive in determining the hardness, since this factor exhibited a very high effect size on this property. Lawson and Albero also reported that the lithium disilicate was harder than feldspathic ceramic [28,37].
Scanning electron microscopy analysis
SEM analysis of the surfaces of all groups of this study showed alterations, irregularities, and pores at varying degrees. There was more degradation of surface with voids and channel when immersed in simulated gastric acid when compared to both control group (artificial saliva) and untreated material before immersion, and this might be due to more aggressive nature of gastric acid and is this caused the dissolution of crystalline structure leading to this appearance and loss of particles from its composition. Similar changes were seen in study conducted by priya and Sinmazisik [38,39]. The results of this study are supported by the study done by Kukiattrakoon [27,32,33]. On dental porcelains surface features due to the acidic agents who stated that SEM pictures of feldspathic ceramics immersed in different acidic agents showed various patterns. Before immersion, surface was dense with little porosity; in deionized water, surface showed a little porosity; there were numerous porosities on the surface immersed in citrate solution and green mango juice; in pineapple juice, surface exhibited the degradation with numerous porosities, and in acetic acid, there were small cracks with surface degradation.
The results of this study are supported by the study conducted by Percy on surface corrosion of dental ceramics [40,41].
Conclusion
Studied the effect of different acid treatments on the surface of porcelain and concluded that the surface was homogenously smooth when etched with APF acid and it was more pronounced and aggressive when etched with HF More degradation of category II when compared to category I was due to heterogeneous crystalline nature of feldspathic ceramics.
References
- Pirvulescu IL, Pop D, Moaca EA, et al. Effects of simulated gastric acid exposure on surface topography, mechanical and optical features of commercial CAD/CAM Ceramic Blocks. Appl Sci 2021; 11:8703.
- Sulaiman TA, Abdulmajeed AA, Shahramian K, et al. Impact of gastric acidic challenge on surface topography and optical properties of monolithic zirconia. Dent Mater J 2015; 31:1445-1452.
[Crossref] [Google Scholar] [Pubmed]
- Kenawy ER. Effect of Simulated Gastric Acid on Surface Roughness of Different Types of Dental Ceramics. Egypt Dent J 2021; 67:711-716.
- Backer AD, Munchow EA, Eckert GJ, et al. Effects of simulated gastric juice on CAD/CAM resin composites morphological and mechanical evaluations. J Prosthodont 2017; 26:424-31.
[Crossref] [Google Scholar] [Pubmed]
- AlShahrani MT, Haralur SB, Alqarni M. Restorative rehabilitation of a patient with dental erosion. Case Rep Dent 2017.
[Crossref] [Google Scholar] [Pubmed]
- Cengiz S, Sarac S, Oezcan M. Effects of simulated gastric juice on color stability, surface roughness and micro hardness of laboratory-processed composites. Dent Mater J 2014; 33:343-348.
[Crossref] [Google Scholar] [Pubmed]
- Esquivel-Upshaw JF, Dieng FY, Clark AE, et al. Surface degradation of dental ceramics as a function of environmental pH. J Dent Res 2013; 92:467-471.
[Crossref] [Google Scholar] [Pubmed]
- Wan Bakar WZ, McIntyre J. Susceptibility of selected tooth-coloured dental materials to damage by common erosive acids. Aust Dent J 2008; 53:226-234.
[Crossref] [Google Scholar] [Pubmed]
- Hetherington MM, Altemus M, Nelson ML, et al. Eating behavior in bulimia nervosa: multiple meal analyses. Am J Clin Nutr 1994; 60:864-873.
[Crossref] [Google Scholar] [Pubmed]
- Amer A. Effect of simulated gastric juice on surface characteristics of direct esthetic restorations. Aus J Basic Applied Sci 2012;6:686-694.
- Cruz ME, Simoes R, Martins SB, et al. Influence of simulated gastric juice on surface characteristics of CAD-CAM monolithic materials. J Prosthet Dent 2020; 123:483-490.
[Crossref] [Google Scholar] [Pubmed]
- Kulkarni A, Rothrock J, Thompson J. Impact of gastric acid induced surface changes on mechanical behavior and optical characteristics of dental ceramics. J Prosthodont 2020; 29:207-218.
[Crossref] [Google Scholar] [Pubmed]
- Fondriest J. Shade matching in restorative dentistry: the science and strategies. Int J Periodontics Restorative Dent 2003;23:467-4
[Google Scholar] [Pubmed]
- Kawai K, Urano M, Ebisu S. Effect of surface roughness of porcelain on adhesion of bacteria and their synthesizing glucans. J Prosthet Dent 2000; 83:664-667.
[Crossref] [Google Scholar] [Pubmed]
- Sagsoz O, Demirci T, Demirci G, et al. The effects of different polishing techniques on the staining resistance of CAD/CAM resin-ceramics. J Adv Prosthodont 2016; 8:417-422.
[Crossref] [Google Scholar] [Pubmed]
- Mohammadibassir M, Rezvani MB, Golzari H, et al. Effect of two polishing systems on surface roughness, topography, and flexural strength of a monolithic lithium disilicate ceramic. J Prosthodont 2019; 28:172-180.
[Crossref] [Google Scholar] [Pubmed]
- Willers AE, da Silva BT, Siriani LK, et al. Effect of erosive and abrasive challenges on the glaze layer applied to ceramic materials. J Esthet Restor Dent 2020; 32:815-822.
[Crossref] [Google Scholar] [Pubmed]
- Sulaiman TA, Camino RN, Cook R, et al. Time-lasting ceramic stains and glaze: A toothbrush simulation study. J Esthet Restor Dent 2020; 32:581-585.
[Crossref] [Google Scholar] [Pubmed]
- Jagger DC, Harrison A. An in vitro investigation into the wear effects of unglazed, glazed, and polished porcelain on human enamel. J Prosthet Dent 1994; 72:320-323.
[Crossref] [Google Scholar] [Pubmed]
- Kukiattrakoon B, Hengtrakool C, Kedjarune-Leggat U. Effect of acidic agents on surface roughness of dental ceramics. J Dent Res 2011;8:6.
[Google Scholar] [Pubmed]
- MOrmann WH, Stawarczyk B, Ender A, et al. Wear characteristics of current aesthetic dental restorative CAD/CAM materials: two-body wear, gloss retention, roughness and Martens hardness. J Mech Behav Biomed Mater 2013; 20:113-125.
[Crossref] [Google Scholar] [Pubmed]
- Belli R, Wendler M, de Ligny D, et al. Chairside CAD/CAM materials. Part 1: Measurement of elastic constants and microstructural characterization. Dent Mater J 2017; 33:84-98.
[Crossref] [Google Scholar] [Pubmed]
- Sen N, Us YO. Mechanical and optical properties of monolithic CAD-CAM restorative materials. J Prosthet Dent. 2018;119:593-599.
[Crossref] [Google Scholar] [Pubmed]
- Harryparsad A, Dullabh H, Sykes L, et al. The effects of hydrochloric acid on all-ceramic restorative materials: an in-vitro S Afr Dent J 2014; 69:106-111.
[Google Scholar] [Pubmed]
- de Carvalho Ramos N, Campos TM, de La Paz IS, et al. Microstructure characterization and SCG of newly engineered dental ceramics. Dent Mater J 2016; 32:870-878.
[Crossref] [Google Scholar] [Pubmed]
- Traini T, Sinjari B, Pascetta R, et al. The zirconia-reinforced lithium silicate ceramic: lights and shadows of a new material. Dent Mater J 2016; 35:748-755.
[Crossref] [Google Scholar] [Pubmed]
- Kukiattrakoon B, Hengtrakool C, Kedjarune-Leggat U. The effect of acidic agents on surface ion leaching and surface characteristics of dental porcelains. J Prosthet Dent 2010; 103:148-162.
[Crossref] [Google Scholar] [Pubmed]
- Lawson NC, Bansal R, Burgess JO. Wear, strength, modulus and hardness of CAD/CAM restorative materials. Dent Mater J 2016; 32:275-283.
[Crossref] [Google Scholar] [Pubmed]
- Egilmez F, Ergun G, Cekic-Nagas I, et al. Does artificial aging affect mechanical properties of CAD/CAM composite materials. J Prosthodont Res 2018; 62:65-74.
[Crossref] [Google Scholar] [Pubmed]
- Baharav H, Laufer BZ, Pilo R, et al. Effect of glaze thickness on the fracture toughness and hardness of alumina-reinforced porcelain. J Prosthet Dent 1999; 81:515-519.
[Crossref] [Google Scholar] [Pubmed]
- Pinto MM, Cesar PF, Rosa V, et al. Influence of pH on slow crack growth of dental porcelains. Dent Mater J 2008; 24:814-823.
[Crossref] [Google Scholar] [Pubmed]
- Junpoom P, Kukiattrakoon B, Hengtrakool C. Surface characteristic changes of dental ceramics after cyclic immersion in acidic agents and titratable acidity. Eur J Prosthodont Restor Dent 2010;18:177-184.
[Google Scholar] [Pubmed]
- Kukiattrakoon B, Hengtrakool C, Kedjarune-Leggat U. Degradability of fluorapatite-leucite ceramics in naturally acidic agents. Dent Mater J 2010; 1008310070.
[Crossref] [Google Scholar] [Pubmed]
- Denry IL, Holloway JA. Elastic constants, Vickers hardness, and fracture toughness of fluorrichterite-based glass–ceramics. Dent Mater J 2004; 20:213-219.
[Crossref] [Google Scholar] [Pubmed]
- Kontonasaki E, Kantiranis N, Papadopoulou L, et al. Microstructural characterization and comparative evaluation of physical, mechanical and biological properties of three ceramics for metal–ceramic restorations. Dent Mater J 2008; 24:1362-1373.
[Crossref] [Google Scholar] [Pubmed]
- Vechiato-Filho AJ, Dos Santos DM, Goiato MC, et al. Surface degradation of lithium disilicate ceramic after immersion in acid and fluoride solutions. Am J Dent 2015;28:174-80.
[Google Scholar] [Pubmed]
- Albero A, Pascual A, Camps I, et al. Comparative characterization of a novel cad-cam polymer-infiltrated-ceramic-network. J clin exp dent 2015;7:495.
[Google Scholar] [Pubmed]
- Priya KS, Kumar MP, Krishna VP, et al. Effect of Acidic Agents on Microhardness and Surface Morphology of Two Metal Ceramic Materials: An In Vitro J Contemp Dent Pract 2019; 20:1329-1334.
[Google Scholar] [Pubmed]
- Sinmazisik G, Ovecoglu ML. Physical properties and microstructural characterization of dental porcelains mixed with distilled water and modeling liquid. Dent Mater J 2006; 22:735-745.
[Crossref] [Google Scholar] [Pubmed]
- Milleding P, Wennerberg A, Alaeddin S, et al. Surface corrosion of dental ceramics in vitro. Biomaterials 1999; 20:733-746.
[Crossref] [Google Scholar] [Pubmed]
- Canay S, Hersek N, Ertan A. Effect of different acid treatments on a porcelain surface 1. J Oral Rehabil 2001; 28:95-101.
[Crossref] [Google Scholar] [Pubmed]
Author Info
Ghadeer S Abdulameer* and Mohammed R Hameed
Department of Restorative and Esthetic Dentistry, College of Dentistry, Baghdad University, IraqCitation: Ghadeer S Abdulameer, Mohammed R Hameed, Influence of Simulated Gastric Juice on Surface Roughness, Morphology and Micro Hardness of Cad-Cam Materials (An In Vitro Study), J Res Med Dent Sci, 2022, 10 (7):000-000.
Received: 06-Jun-2022, Manuscript No. JRMDS-22-55974; , Pre QC No. JRMDS-22-55974; Editor assigned: 09-Jun-2022, Pre QC No. JRMDS-22-55974; Reviewed: 23-Jun-2022, QC No. JRMDS-22-55974; Revised: 08-Aug-2022, Manuscript No. JRMDS-22-55974; Published: 16-Aug-2022

