Research - (2021) Volume 9, Issue 7
Machine Learning Approaches for Optimal Parameter Selection for Hepatitis Disease Classification
Rukayya Umar1, Moussa Mahamat Boukar1, Steve Adeshina1 and Senol Dane2*
*Correspondence: Faculty of Basic Medical Sciences. Senol Dane, Department of Physiology, Nile University of Nigeria, Nigeria, Email:
Abstract
Background: In the field of medicine, diagnosis is very important issue. In effort to address the issue Machine learning is being utilized for model development for classification and diagnosis purposes. Feature selection (course of dimensionality reduction) is an important component of ML to increase model performance by reducing redundant features which may degrade model performance accuracy. Objective: The goal of this work is to identify among three feature selection approaches which one gives optimal solution (subset of features) that when used for classification provides the best fit performance accuracy and minimized CPU time. Method: using newly created subsets of features we develop model M for hepatitis disease classification for dataset D (xi,yi) where subsets {x1…,xn} contribute to target variable as the original features do. Chi-square, Genetic Algorithm and Principal Component Analysis (PCA) were implemented for feature selection and three classical machine learning algorithms were used for the classification including Naïve Bayes, Support Vector Machines and Logistic Regression. Results: The classification performance of the classifiers on the reduced features for Hepatitis disease is estimated using classification accuracy, recall and precision analysis. Experimental result shows the combination of Chi-Square feature selection method and Logistic classifier achieved the best result having 92% accuracy within a desirable CPU time.
Keywords
Machine learning, Hepatitis, Disease classification.
Introduction
Hepatitis disease has been recognized by the World Health Organization (WHO) as dangerous disease with high mortality and morbidity rates, a life-threatening disease with about 1.7 million people getting infected on a yearly basis around the globe [1], is an inflammation of the liver, most commonly caused by a viral Hepatitis [2]. According to [3] common challenge in healthcare today physicians have access to massive amounts of data on patients, but little time nor tools to mine them and extract useful information [3]. Diagnosis of hepatitis has become an important issue in the field of medicine and machine learning, statistical modelling [4], data mining has been used for such tasks in healthcare settings [5]. Machines now have the ability to perform some task based on reasoning that only humans were capable of doing decades ago [6]. These machines are made intelligent by the power of Artificial Intelligence (AI), the ability of machines to perform cognitive and intelligent tasks [7]. ML is concerned with the question of how to build models that automatically improve intelligence by learning from experience [8]. Programs developed based on machine learning have proven to perform better than traditional approaches attempted to perform same task. ML algorithms are also used in knowledge discovery from large commercial databases [9, 10] as a diagnosis tool, disease prediction among others. Several ML algorithms have been used in different medical domains, ranging from Heart disease prediction, Diabetes, Cancers, Hepatitis diseases and others [11, 12].
Feature selection
Datasets collected come with a number of dimensions (features) or attributes. These features are necessary for classification or prediction task as each feature (independent variable) have some degree of contribution to target variable (dependent variable) however, when the dimension is much (course of dimensionality) becomes an issue for the model performance. Hence, the goal of feature selection process is given a dataset n described by m features (m dimensions), is to find the minimum number of m describe the dataset as much as the original set of attributes do [13]. FS are used to remove noninformative or redundant attributes from original feature vector which do not contribute much to performance of the model [14]. Redundant features deteriorate performance or add uncertainty and reduce general effectiveness of a model. Different techniques including Genetic Algorithm a meta-heuristic algorithm which offer a natural way to solve the problem, Chi-Square, Principal Component Analysis, Scale-invariant Feature Transformation (SIFT) mainly for image detection [15] etc. have been used to implement the task of feature selection algorithms. The recent development of covid-19 pandemic has the globe searching for an alternative to its diagnosis, study carried out by [16] introduced an alternative way of diagnosing the Covid-19 beside the PCR currently used, they achieved good results with waiting time reduced from 24-48hours to 58 minutes.
The goal of this study is therefore to identify among three feature selection methods namely, Genetic algorithm, Principal component analysis and Chi-Square which gives an optimal solution (subset of features) a reduced dimension that when used for classification produces best fit performance accuracy and minimized computational time for hepatitis disease datasets (Figure 1).

Figure 1: Feature selection.
Literature Review
In effort to achieve good model performance, researchers have applied different Feature selection approaches for dimensionality reduction different tasks ranging from numerical datasets to images. Microarray dataset is associated with the issue of high dimensionality, feature selection techniques are used to reduce this huge dimensionality in datasets. The work of sabah et al. presented an ensemble feature selection technique based on t-test and Genetic Algorithm GA. Optimal subset of features were obtained using Nested-GA which consist of two nested genetic algorithms outer and inner. Outer Genetic Algorithm (OGA-SVM) works on microarray gene expression datasets while Inner Genetic Algorithm (IGANNW) works on DNA methylation datasets. Incremental Feature Selection (IFS) was used to get minimal optimal genes subset [17]. Work in [18] modified the representation of chromosome to suit huge-scale FS and adopt speciation to improve performance of FS by obtaining diverse solutions. DNA microarray data from cancer patient was used for experiment, it is shown that selected genes by their method obtained good result. The work of Pedram et al. introduced a new approach for FS based on integration of GA and Particle Swarm Optimization, accuracy of svm classifier on validation sample was used as fitness value [19], the approach select relevant features within a justifiable cpu time, the method was tested for road detection and produced desirable results. In their work, Bir bhanu et al. presented GA approach is for optimal FS in SAR Images. Four different stages were developed for target detection, and a new fitness function was proposed. The fitness function; based on minimum description length principle (MDLP) to drive GA. Experimental results show effectiveness of the of the fitness function over other fitness functions [20]. The work in [13] proposed algorithm that uses inconsistency rate to evaluate the fitness of individuals in the population independent of learning algorithm, this result in speeding up the FS process and maintained predictive accuracy. Support vector machines problem of feature selection was attempted by the means of GA which proposed the use of theoretical bounds on generalization error [21]. According to [14] lack exploitation capability is a problem that affects the local search ability of Genetic algorithm. Their work integrated Great Deluge Algorithm with GA to solve the afore-mentioned problem for effective FS. The capability of proposed new variant of GA for FS has been tested on 15 different datasets using three classical classifiers. Similarly, a hybrid GA for FS wrapper based on mutual information was introduced, include two optimization stages outer and inner stages, this is for global search of best relevant subsets of features in a wrapper manner and for local search in a filter manner, on a range of benchmark datasets result shows good performance [22]. In work [23] the authors proposed novel approach t feature selection in credit card scoring applications, uses information gain to rank features. A new Local search based on hybrid GA for FS presented in [24] called HGAFS, the approach select silent feature subset within a reduced size. The work of Feng tan et al. [25] proposed a framework based on GA that combines several FS methods with the advantage of ability to accommodate various FS criteria. An exploration of feature selection and classification methods for prediction heart disease was conducted by [26] where principal component analysis, Chi -square testing , ReliefF and symmetrical uncertainty were explored for creating unique feature sets. The findings show that benefits of using FS vary depending on machine learning technique used. However, Chi-Square feature selection with BayesNet algorithm produced the best performance on datasets considered. Similarly study [27] investigated the effect of improved CHI (impCHI) Square on six classical ML classifiers and found that impCHI square outperform the ordinary chi-square with all six ML techniques. It has also been applied Serial Analysis of Gene Expression (SAGE) in [28] for gene selection and it has improved the performance of the classifiers. Robust FS methods for multi-label learning, the method perform feature correlation and feature selection simultaneously and have performed efficiently [29].
Rezaei proposed algorithm based on Principal Component Analysis (PCA) and Error Minimized Extreme Learning Machine (EMELM). Feature reduction was applied and get the dataset normalized in (0,1) range and reduce the complexity [30], classification of EMELM with automatic determination of the number of hidden nodes and updating output weights shows better functionality and speed. Vijayaram used C4.5 decision tree for diagnosis, 19 attributes such as age, sex, steroids, antivirals, spleen, etc. were considered for the diagnosis of the disease [31]. Avci proposed a system based on Genetic Wavelet Kernel Extreme Learning Machine (GAWK- ELM). Optimization was done using GA. Classification accuracy of proposed GA-WKELM method is found to be 97.5623% in case of values of w, x, y wavelet kernel function parameters, which are 15, 3 and 10, and hidden neuron with 86 [32]. Akiladevi Analyzed feature selection and classification algorithms on Hepatitis dataset, data was classified into predefined categorical class labels, Feature selection; the model complexity was reduced by feature reduction to improve model performance accuracy. Application of several filters like Fisher filtering, Relief filters, step Disc feature selection algorithms added strength to the model [33]. Chown also evaluated the performance of prediction algorithms, Ortho coding and Pseudo coding feature extraction methods were implemented and used. ANN, RF, GLM, LDA, and SVM were applied to predict HCV protease specificity in the datasets. Three different evaluators were used: Receiving-Operator Characteristics (ROC) curves, precision-recall (PR) curves and Matthewscorrelation coefficient (MCC) [34]. Analysis of performance metrics shows that application of pseudoor ortho-coded datasets to a classifier greatly affects a model’s performance. Ensari in his work analyzed performance of various algorithms and feature selection methods on hepatitis Disease, Naïve Bayes Classifier, Logistic Regression and J48 DT were used and compared according to filter-based feature selection methods. For filter-based feature selection, Cfs Subset Eval, Info Gain Attribute Eval and Principal Components have been used and the performance is evaluated in terms of precision, recall, F-Measure and ROC Area, Naïve Bayes Classifier has higher classification accuracy on the Hepatitis dataset. The study shows that filter-based feature selection is Principal Components gave the highest accuracy [35]. Another approach proposed by Nilashi et al. on application of ensembles of neuro-fuzzy technique to develop a hepatitis disease prediction model. Where NIPALS was used in data dimension reduction, clustered using SOM, features selected using CART and ANFIS ensemble. Neuro-fuzzy is a combination of NN with fuzzy logic algorithms to complement one other [36]. Study conducted by [37] predicted prognosis of hepatitis using SVM and wrapper method, 10 out of 20 attributes were selected. The accuracy obtained before and after the application of attribute selection projected that feature selection can help increase accuracy of SVM. The accuracy obtained is 74.55%. Similarly, Nair compared various machine learning techniques for the prediction, performance metric based on accuracy rate and mean square error. (SVM), K Nearest Neighbor (KNN) and ANN were considered [38].
Materials and Methods
In this study, a number of classifiers have been implemented in the prediction of Hepatitis disease datasets. The algorithms considered include Logistics Regression, SVM and Naïve Bayes algorithms. Below we give a description on all the models considered in this study. The task is to generate a subset of features using three different approaches to get the new datasets, and build three classifiers with the new feature subsets to perform hepatitis classification problem which is to classify discrete class labels for unlabelled patterns based on experience gain during training phase.
The models were trained with 80% of the datasets and testing was done using 20%. Each of the models build have different underlying ideas in which each model operates. We firstly perform classification task full feature, secondly perform feature selection using three approaches and generated different subset of features from each approach. Thirdly using the created subsets of features we perform classification and amazing results were obtained. Figure 2 below depicts the summary of our research approach.

Figure 2: Research approach.
Principal component analysis
Principal Component Analysis (PCA) is a technique of reducing the dimensionality of datasets into smaller dimensions increasing interpretability and still minimizing information loss. [39] Provides an approximation of a data table, a data matrix, X, in terms of product of two matrices T and P’[40]. These matrices capture the essential data patterns of X. Problem of fitting a linear subspace SIRD of unknown dimension d
Chi-Square feature selection
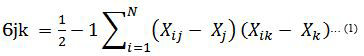
In effort to build an effective model M for hepatitis disease prediction from data set D(xi,yi) most relevant features independent variable X ranging {x1…,xn} to the target(dependent) variable. Chi-square is based on X2 statistic, discretizes numeric attributes iteratively up until some inconsistencies are found in the data, thus achieve feature selection via discretization [42]. Rank features based on statistical significance test and consider only those features that are dependent on the class label [43]. The significance is obtained using equation 1 below. The higher a chi-squared test score is the most likely to be independent and hence should be part of new set of features. Formula utilized by Chi- Square is presented in equation (2).

In our study the feature significance of top ten features was used as new subset of features for classification.
Genetic algorithm
Genetic Algorithm (GA) one of the population-based stochastic algorithm in history, adaptive methods which may be used to solve search and optimization problems. Inspired by genetic process of biological organisms. The main components of GA are initial population of chromosome=[p1, p2, p3….pN], fitness function for optimization, selection, crossover and mutation [44,45]. The various solutions called chromosomes are evaluated using a fitness function and suitable ones are selected to form new population through crossover and then mutation is applied [46].
Datasets description
The data was obtained from UCI repository; the data contains 19 attributes (features) and one label (target variable). It is a binary classification where the target is either class zero or class one. The was split into training set seventy (80%) and testing set (20%) split (Table 1).
Experiment results and evaluation metrics
Three classification algorithms were used namely, Logistics Regression, Support Vector Machines and Naïve bayes classifiers. Logistic regression is a statistical algorithm used in the field of machine learning to solve classification and regression problems [47]. Support vector machines: a machine-based technology, is a class separation approach, which depends on statistical learning theory developed by Vapnik constructs a maximum margin separator also known as decision boundary with largest possible distance to example points. It creates a separating hyperplane in the original two-dimensional space. Maps the input variable to an ndimensional feature space, also solves some regression problem. Support Vector Machine SVM A supervised machine learning algorithm mainly used for binary classification problem. It is trained by feeding a dataset with labeled examples (xi, yi). Where x represents features and y represent the target variable. Datasets are defined as n-dimensional feature vector that can be plotted on n-dimensional space. And Naïve Bayes: a method used for classifying objects based on closest training examples in the feature space, the most basic type of instance-based learning or lazy learning. It assumes all instances are points in n-dimensional space [48]. To measure the performance of each of the models, accuracy, precision (the proportion of positively classified results either true positive or true negative) and recall of confusion matrix were used. It is a 2 x 2 matrix which compares the predicted class with actual class. The evaluation metrics can then be defined as follows: predictive accuracy is the proportion of correctly classified outcomes either true positive or true negative.
Accuracy=(TP+TN)/(TP+FP+FN+TN) … (3)
Precision=TP/(TP+FP) ...…………... (4)
Recall=TP/(TP+FN) ………. …. (5)
True Positive (TP): number of patients who are classified correctly. False Positive (FP) also known as type I error, number of patients classified wrongly. False Negative also known as type II error and True Negative (TN). For experimentation, three classical machine learning algorithms were used. They are NB, LR and SVM. Support Vector Machine Logistic fits a logistic regression model to the data with a ridge estimator.
Feature selection results
In effort to obtained optimal parameter for Hepatitis disease from Hepatitis disease dataset obtained from UCI as described above, three different dimensionality reduction approaches (feature selection) were applied to the datasets. Chi-Square, PCA and genetic Algorithm and were able to select a subset of features presented in table 1 for Chi-square test and Genetic Algorithm and table 2 for principal components or optimal variables created by PCA respectively. The resulting subset of features ware used for classification where Logistics regression, Support Vector Machines and Naïve bayes classifiers were used.
Table 1: Datasets attributes and associated values.
| S/N | Features | Values |
|---|---|---|
| 1 | Class | die=1, live=2 |
| 2 | Age | 10, 20, 30, 40, 50, 60, 70, 80 |
| 3 | Sex | male, female |
| 4 | Steroid | no, yes |
| 5 | Antivirals | no, yes |
| 6 | Fatigue | no, yes |
| 7 | Malaise | no, yes |
| 8 | Anorexia | no, yes |
| 9 | Liver big | no, yes |
| 10 | Liver firm | no, yes |
| 11 | Spleen Palpable | no, yes |
| 12 | Spiders | no, yes |
| 13 | Ascites | no, yes |
| 14 | Varices | no, yes |
| 15 | Bilirubin | 0.39, 0.80, 1.20, 2.00, 3.00,4.00 |
| 16 | Alk phosphate | 33, 80, 120, 160, 200, 250 |
| 17 | SGOT | 13, 100, 200, 300, 400, 500, |
| 18 | Albumin | 2.1, 3.0, 3.8, 4.5, 5.0, 6.0 |
| 19 | Protime | 10, 20, 30, 40, 50, 60, 70, 80,90 |
| 20 | Histology | no, yes |
Table 2: Selected subset of features.
| S/n | Chi-Square | Genetic Algorithm |
|---|---|---|
| 1 | Age | Age |
| 2 | Malaise | Sex |
| 3 | Spiders | Steroid |
| 4 | Ascities | Fatigue |
| 5 | Bilirubin | Anorexia |
| 6 | Alk_phosphate | alk_phosphate |
| 7 | Sgot | Sgot |
| 8 | Albumin | Albumin |
| 9 | Histology | Protime |
Table 2 above contained the selected features by Chisquare and Genetic Algorithm, we ran Genetic algorithm for 10 generations and the optimal individuals that achieve the highest validation accuracy are the features used for the classification in all the three ML classifiers. Chi-Square test also selected top 9 features based on the feature scores and the newly formed datasets was used for the classification.
Figure 3 shows the sample principal components formed as a result of dimensionality reduction from 19dimensions to 2, shows the condensed information from all features incorporated in principal component one and principal component 2.

Figure 3: Principal components sample.
Classification results
After getting features selected three classifiers were built and the resulting accuracy are presented in the figures below.

Figure 4: Model accuracy on Chi-square FS.

Figure 5: Model accuracy on GA FS.

Figure 6: Model accuracy on PCA FS.
Conclusion
In the development of Machine learning model for classification of diagnosis purposes, the model performance is of outmost importance especially in medicine, type I and type II errors needs to be minimized. One approach to achieving this is through dimensionality reduction as reviewed in the literature. In this study, three feature selection approaches have been implemented for optimal parameter selection of hepatitis disease classification. These approaches have shown that feature selection is an important tool for improving model performance for most of machine learning algorithms. The three classifiers built the combination of Chi-square and Logistic regression produced the highest classification accuracy whereas in the case of Principal component analysis and Naïve Bayes classifier produced the least performance accuracy with lower accuracy than obtained with full dimensions of the original datasets, which is the only case where FS reduce performance accuracy. Therefore, we conclude that feature selection is a great tool for increasing performance of a model, However, the combination of a Feature selection approach with a classifier is an important one, different FS approach have good compatibility with certain classifiers and vice versa.
References
- http://apps.who.int/iris/bitstream/10665/255016/1/9789241565455-eng.pdf?ua=1
- Antony Leo Jerry T, S Sundari. A study of estimation and analysis of hepatitis B antibody titres in adolescent children attending a tertiary care hospital. J Res Med Dent Sci 2021; 9:310-317.
- Choi E, Bahadori MT, Schuetz A, et al. Doctor AI: Predicting clinical events via recurrent neural networks. InMachine learning for healthcare conference 2016.
- Boukar M, Dane S, The effects of sex, education and marital status on alexithymia. J Res Med Dent Sci 2019; 7:82–85.
- Abd El-Salam SM, Ezz MM, Hashem S, et al. Performance of machine learning approaches on prediction of esophageal varices for Egyptian chronic hepatitis C patients. Informatics Med Unlocked 2019; 17:100267.
- Shalev-Shwartz S, Ben-David S. Understanding machine learning: From theory to algorithms. Cambridge university press 2014.
- Brewka G. Artificial intelligence-A modern approach by Stuart Russell, Peter Norvig, Prentice Hall. Series in artificial intelligence, Englewood Cliffs, NJ 1996; 11.
- https://kkpatel7.files.wordpress.com/2015/04/alppaydin_machinelearning_2010.pdf
- http://www.cs.cmu.edu/~tom/mlbook.html
- Kumar NK, Vigneswari D. Hepatitis-infectious disease prediction using classification algorithms. Res J Pharmacy Technol 2019; 12:3720-5.
- Suryakirani RP, Porkodi R. Comparative study and analysis of classification algorithms in data mining using diabetic dataset. Int J Scientific Res Sci Technol 2018; 4:299-304.
- Tomar D, Agarwal S. Hybrid feature selection based weighted least squares twin support vector machine approach for diagnosing breast cancer, hepatitis, and diabetes. Adv Artificial Neural Systems 2015; 2015.
- Lanzi PL. Fast feature selection with genetic algorithms: a filter approach. InProceedings of 1997 IEEE International Conference on Evolutionary Computation (ICEC'97) 1997.
- Guha R, Ghosh M, Kapri S, et al. Deluge based genetic algorithm for feature selection. Evolutionary Intelligence 2019; 1-1.
- Lowe DG. Concrete making materials. Concr Prod 2002; 20.
- Muhammed MM, Boukar MM, Aldullahi SE. The application of artificial intelligence technique (CNN-Alexnet ) in diagnosing COVID-19 using chest X-ray images. J Res Med Dent Sci 2021; 9:21-26.
- Sayed S, Nassef M, Badr A, et al. A nested genetic algorithm for feature selection in high-dimensional cancer microarray datasets. Expert Systems App 2019; 121:233-43.
- Hong JH, Cho SB. Efficient huge-scale feature selection with speciated genetic algorithm. Pattern Recognition Letters 2006; 27:143-50.
- Ghamisi P, Benediktsson JA. Feature selection based on hybridization of genetic algorithm and particle swarm optimization. IEEE Geoscience Remote Sensing Letters 2014; 12:309-13.
- Bhanu B, Lin Y. Genetic algorithm based feature selection for target detection in SAR images. Image Vision Computing 2003; 21:591-608.
- Fröhlich H, Chapelle O, Schölkopf B. Feature selection for support vector machines by means of genetic algorithms. InProceeding ICTAI 2002; 3.
- Huang J, Cai Y, Xu X. A hybrid genetic algorithm for feature selection wrapper based on mutual information. Pattern Recog Letters 2007; 28:1825-44.
- Jadhav S, He H, Jenkins KW. An academic review: Applications of data mining techniques in finance industry. 2008.
- Kabir MM, Shahjahan M, Murase K. A new local search based hybrid genetic algorithm for feature selection. Neurocomputing 2011; 74):2914-28.
- Tan F, Fu X, Zhang Y, et al. A genetic algorithm-based method for feature subset selection. Soft Comput 2008; 12:111-20.
- Spencer R, Thabtah F, Abdelhamid N, et al. Exploring feature selection and classification methods for predicting heart disease. Digital Health 2020; 6:2055207620914777.
- Alshaer HN, Otair MA, Abualigah L, et al. Feature selection method using improved CHI Square on Arabic text classifiers: Analysis and application. Multimedia Tools App 2021; 80:10373-90.
- Jin X, Xu A, Bie R, et al. Machine learning techniques and chi-square feature selection for cancer classification using SAGE gene expression profiles. International workshop on data mining for biomedical applications. Springer 2006.
- Huang LL, Tang J, Chen SB, et al. An efficient algorithm for feature selection with feature correlation. In International Conference on Intelligent Science and Intelligent Data Engineering. Springer 2012.
- Khorashadizade N, Rezaei H. New method for rapid diagnosis of Hepatitis disease based on reduction feature and machine learning. J Adv Computer Sci Technol 2015; 4:148.
- Sowmien VS, Sugumaran V, Karthikeyan CP, et al. Diagnosis of hepatitis using decision tree algorithm. Int J Eng Technol 2016; 8.
- Avci D. An automatic diagnosis system for hepatitis diseases based on genetic wavelet kernel extreme learning machine. J Elec Eng Technol 2016; 11:993-1002.
- Nancy P, Sudha V, Akiladevi R. Analysis of feature selection and classification algorithms on hepatitis data. Int J Adv Res Comp Eng Technol 2017; 6:19-23.
- Chown H. A comparison of machine learning algorithms for the prediction of Hepatitis C NS3 protease cleavage sites. J Proteomics Bioinform 2019; 12:088-93.
- Bayrak EA, Kirci P, Ensari T. Performance analysis of machine learning algorithms and feature selection methods on hepatitis disease. Int J Multidisciplinary Studies Innovative Technol 2019; 3:135-8.
- Nilashi M, Ahmadi H, Shahmoradi L, et al. A predictive method for hepatitis disease diagnosis using ensembles of neuro-fuzzy technique. J Infection Public Health 2019; 12:13-20.
- Meyer D, Leisch F, Hornik K. The support vector machine under test. Neurocomputing 2003; 55:169-86.
- Yarasuri VK, Indukuri GK, Nair AK. Prediction of hepatitis disease using machine learning technique. In 2019 Third International conference on I-SMAC (IoT in Social, Mobile, Analytics and Cloud) (I-SMAC) 2019.
- Jolliffe IT, Cadima J. Principal component analysis: A review and recent developments. Philosophical Transactions Royal Society A: Mathematical Physical Eng Sci 2016; 374:20150202.
- https://files.isec.pt/DOCUMENTOS/SERVICOS/BIBLIO/Documentos%20de%20acesso%20remoto/Principal%20components%20analysis.pdf
- Kong H, Wang L, Teoh EK, et al. Generalized 2D principal component analysis for face image representation and recognition. Neural Networks 2005; 18:585-94.
- Tay FE, Shen L. A modified chi2 algorithm for discretization. IEEE Transactions on knowledge and data engineering 2002; 14:666-70.
- H. Liu and R. Chi2: Feature selection and discretization of numeric attributes. Proc Int Conf Tools Artif Intell 1995; 388–391.
- Mirjalili S. Genetic algorithm. Stud Comput Intell 2019; 780:43–55.
- Mitchell M. An introduction to genetic algorithms. An Introd Genet Algorithms 2020; 1–40.
- http://www.geocities.ws/francorbusetti/gabeasley1.pdf
- Akkoç S. An empirical comparison of conventional techniques, neural networks and the three stage hybrid adaptive neuro fuzzy inference system (ANFIS) model for credit scoring analysis: The case of Turkish credit card data. Eur J Operational Res 2012; 222:168-78.
- Saxena K, Khan Z, Singh S. Diagnosis of diabetes mellitus using k nearest neighbor algorithm. Int J Computer Sci Trends Technol 2014; 2:36-43.
Author Info
Rukayya Umar1, Moussa Mahamat Boukar1, Steve Adeshina1 and Senol Dane2*
1Department of Computer Science, Nile University of Nigeria, Nigeria2Department of Physiology, Nile University of Nigeria, Nigeria
Citation: Rukayya Umar, Moussa Mahamat Boukar, Steve Adeshina, Senol Dane,Machine Learning Approaches for Optimal Parameter Selection for Hepatitis Disease Classification, J Res Med Dent Sci, 2021, 9(7): 526-535
Received: 03-Jun-2021 Accepted: 06-Jul-2021