Research Article - (2021) Volume 9, Issue 11
Peak Expiratory Flow Profile among Healthy Adult Individuals in Central Kerala- A Cross-sectional Observational Study
Jebu A Thomas1, Sethu Babu2*, Suresh S David3, Krishna Prasad G1, Arjun James2*, Anoop James George4 and Jeny Augustine5
*Correspondence: Sethu Babu, Department of Emergency Medicine, Pushpagiri Institute of Medical Sciences, Thiruvalla, Kerala, India, Email: Arjun James, Department of Emergency Medicine, Pushpagiri Institute of Medical Sciences, Thiruvalla, Kerala, India, Email:
Abstract
Introduction: Lung function reference value is dependent on several factors such as age, gender, ethnicity, environmental conditions as well as the altitude of their dwelling habitat. Therefore, optimizing the reference values of Peak expiratory flow rate (PEFR) to suit different population groups is important to establish the normal range. The present study was conducted to determine the normal reference range of PEFR using a validated Peak flow meter among healthy adult individuals of Central Kerala and to derive regression equations for predicting normal PEFR in this population. Materials and methods: Individuals between the age of 15 and 69 years were initially screened with a pre-designed questionnaire that included health and demographic parameters. Only those individuals who were found to be in good health status were recruited for the study. PEFR was measured using a Peak Flow Meter having a European Union scale and Height was measured using a standard wall mount stadiometer. The regression equations for predicting normal PEFR were calculated from the observed values using multiple regression analysis. Results: A total of 1276 volunteers were included in the study as per the inclusion and exclusion criteria. The PEFR value had a strong association with age, gender, and height. It was observed that there was a linear relationship between height and PEFR in both males and females. The reference equations incorporating age and height in both the genders were as follows: PEFR in males=41.05 - (3.5 x Age)+(333.7 × Height in cm) PEFR in females=-213.8 - (1.3 x Age)+(430.3 × Height in cm) Conclusion: In this study, by using a validated peak flow meter, we derived the regression equations to predict the normal PEFR in the adult population in Central Kerala.
Keywords
Peak expiratory flow rate (PEFR), Reference values, Peak flow meter, Regression equations
Introduction
Peak Expiratory Flow Rate (PEFR) is the simplest ventilatory function test that can measure airflow limitation [1]. It has proven as a valuable adjunct in the evaluation and management of patients with common airway diseases like Bronchial Asthma or Chronic obstructive Pulmonary Disease [2-4]. However, the reference values for PEFR are highly variable and depend on several factors like age, sex, ethnicity, physical activity, environmental conditions, dwelling altitude, tobacco smoking, and socioeconomic status [5-8]. Regional differences in lung functions in healthy individuals in the Indian sub-continent have been observed in several studies [9-15]. Therefore, optimizing the reference values of PEFR to be appropriate for different population groups is important to establish the normal range to be expected for a healthy person from that representative group is indeed desirable. Additionally, predicting the PEFR values according to age, height, and sex, and applying it to the clinical practice will eventually empower the treating physician to manage patients with respiratory diseases like Bronchial Asthma (BA), Chronic Obstructive Pulmonary Disease (COPD), or Occupational lung diseases [2,3,16-18]. In this context, the present study is aimed to estimate the normal reference range of PEFR using a calibrated peak flow meter in healthy adult individuals of Central Kerala and to derive regression equations for predicting normal PEFR from the obtained values.
Materials and Methods
Study design and procedure
The study was designed as a single-centre, hospitalbased, cross-sectional, observational study and was conducted at the Department of Emergency Medicine, Pushpagiri Institute of Medical Sciences, Tiruvalla, Kerala. The study protocol was approved by the Institutional Ethics Committee. The sample size was calculated based on previously conducted study results, using the following statistical formula:
N= 4(SD)2/(CL)2
Where, N – Sample size for the study; SD – Standard Deviation; CL – Confidence Limit.
From the study conducted by Ray et al, assuming a mean PEFR of 400L/minute and a standard deviation of 80L/min along with a confidence limit of 25L/min and an alpha error of 5%, the sample size is 40.96 [13]. Therefore, we decided to include 50 samples in each age category for both males and females. The study was completed over a period of 18 months from March 2015 to August 2016. Individuals aged greater than 15 years who were apparently healthy with no history of smoking and residing in Central Kerala were included in the study (mainly the attendees and visitors of the patients who registered in the Emergency Department of the hospital). A pre-designed questionnaire was used to document relevant information such as age, sex, occupational exposure, environmental exposure, medical and treatment history. They were then subjected to clinical examination to rule out any abnormalities contributing to low PEFR. Exclusion criteria included subjects with pregnancy, morbid obesity, current or past history of smoking, history of dyspnoea on exertion, wheeze, acute or chronic cough, structural abnormalities of thoracic cage/spine, respiratory tract infection within the previous two weeks and those who were consistently unable to perform the procedure. Height measurements were taken by using a standard wall-mounted stadiometer and values were recorded in ‘cm’. Weight was measured using an electronic weighing scale which was calibrated each day, using standard weight. From the measured height and weight, Body Mass Index (BMI) was calculated. PEFR was measured using a Peak Flow Meter having a European Union scale using the standard protocol and clear instructions from the investigators. The highest PEFR value from the three correctly performed manoeuvres was taken as the final value. The Peak Flow Meter was calibrated initially with Vitalograph Pneumotrac™ Spirometer (Model 6800) and thereafter on all days of the study.
Statistical analysis
All data were entered into MS EXCEL and then analyzed with the help of SPSS (Statistical Package for Social Sciences) version 17.0. Using these data, a regression equation was obtained for both males and females which is depicted in the form of tables, figures and diagrams wherever necessary.
Results
Age and gender distribution
A total of 1276 subjects participated in this study, out of which 609 (47.7%) were males and 667 (52.3%) were females. The subjects were divided into 11 groups based on age and in each age group, there were more than 50 males and 50 females. Table 1 shows the age and gender distribution of the study sample.
| Age in years | Males | Females | Total |
|---|---|---|---|
| 15-19 years | 53 | 59 | 112 |
| 20-24 years | 55 | 84 | 139 |
| 25-29 years | 62 | 61 | 123 |
| 30-34 years | 57 | 54 | 111 |
| 35-39 years | 52 | 58 | 110 |
| 40-44 years | 54 | 52 | 106 |
| 45-49 years | 56 | 56 | 112 |
| 50-54 years | 52 | 53 | 105 |
| 55-59 years | 54 | 51 | 105 |
| 60-64 years | 58 | 60 | 118 |
| 65-69 years | 56 | 79 | 135 |
| TOTAL | 609 | 667 | 1276 |
Table 1: Age and gender distribution of study sample.
Correlation of PEFR with age and height
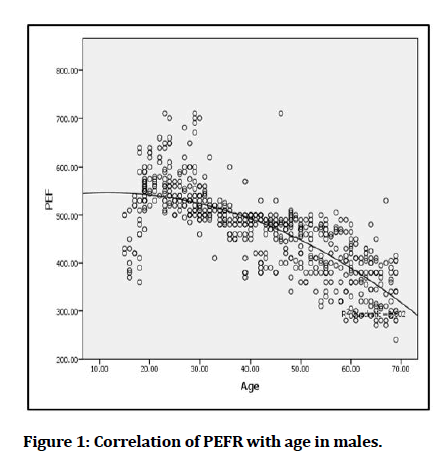
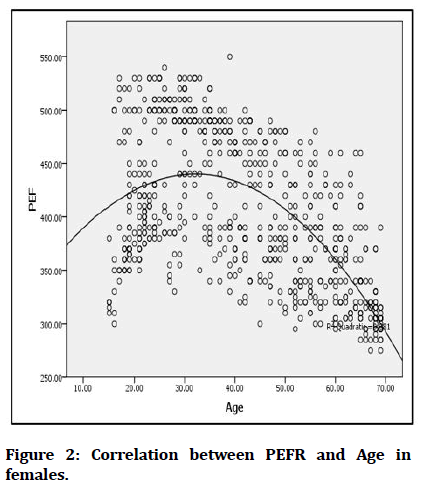
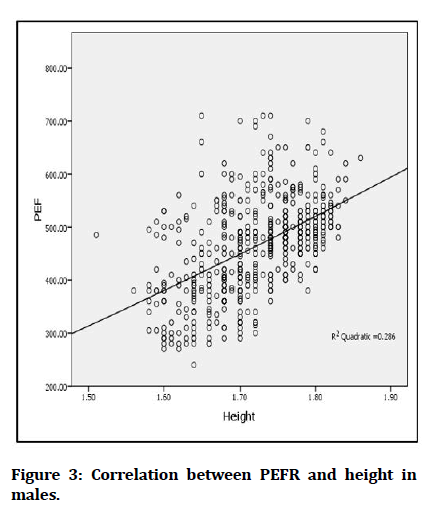
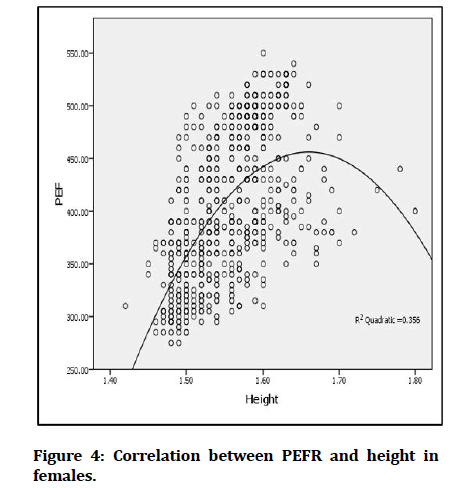
The peak value of PEFR in males is found to be in the age group between 20-24 years and that in females is found to be in the age group between 30-34 years (Table 2). In males, it was observed that there was a decline in PEFR with increasing age (Figure 1). In females, after the age of 35 years, there was a decline in PEFR with increasing age (Figure 2). PEFR of males was plotted against height and it was observed that PEFR in males increased with increasing height (Figure 3). But, in females when PEFR was plotted against height, it was observed that PEFR in females increased with increasing age till the height of about 170cms, and thereafter there was a decline in PEFR (Figure 4).
| Age group | Mean PEF (L/min) among males | PEF SD (L/min) among males | Mean PEF (L/min) among females | PEF SD (L/min) among females |
|---|---|---|---|---|
| 15-19 years | 504 | 69 | 395 | 63 |
| 20-24 years | 580 | 48 | 428 | 51 |
| 25-29 years | 554 | 53 | 458 | 62 |
| 30-34 years | 518 | 38 | 474 | 43 |
| 35-39 years | 483 | 39 | 443 | 57 |
| 40-44 years | 469 | 38 | 414 | 55 |
| 45-49 years | 465 | 52 | 399 | 52 |
| 50-54 years | 433 | 49 | 379 | 52 |
| 55-59 years | 410 | 56 | 378 | 50 |
| 60-64 years | 380 | 51 | 356 | 42 |
| 65-69 years | 341 | 55 | 321 | 35 |
Table 2: Mean and standard deviation (SD) of PEFR in different age groups among male and female subjects.
Figure 1: Correlation of PEFR with age in males.
Figure 2: Correlation between PEFR and Age in females.
Figure 3: Correlation between PEFR and height in males.
Figure 4: Correlation between PEFR and height in females.
Calculation of regression equation
From the data from 1267 healthy subjects (Males: 609; Females: 667), multiple regression equations were derived. Gender, height, and age were the most important determinants of the predicted PEFR. Using age and height as regression coefficients, separate linear regression equations were derived for males and females.
PEF=β0 + β1 × Age + β2 × Height
β0, β1 and β2 in this equation are the regression coefficients.
The regression equations obtained for predicting PEFR values in males is as follows:
PEFR in males=41.05 - (3.5 × Age)+(333.7 x Height) (r2– 0.626)
The regression equations obtained for predicting PEFR values in females is as follows:
PEFR in females=-213.8 - (1.3 x Age) + (430.3 x Height) (r2–0.34)
Discussion
This study has aimed to find out the normal reference range for PEFR in the healthy adult population in central Kerala as our hospital caters to patients predominantly from this region. A total of 1276 individuals with good health (based on the questionnaire as well as clinical examination) have participated in this study.
There was minimal female preponderance among the 1276 individuals included in the study i.e.,52.3% were females. The peak value of PEFR in males is found to be in the age group between 20-24 years and that in females is found to be in the age group between 30-34 years which is comparable to the findings in the study done by Kodgule RR et al. [15] consistent with the findings in the above-mentioned study, PEFR values are lower in females when compared to males of having same age and height [15].
Like the findings in a study done by Nunn AJ et al among the European population, we have also observed a significant correlation between PEFR and age.19 It is observed that there is a decrease in PEFR by 2-3L/min with every one-year increase in age. In males, PEFR value trends upwards at a younger age, reaches a peak by the early 3rd decade, and then decreases serially with advancing age. In females, PEFR shows an increasing trend till the early half of the fourth decade and from the latter half of the fourth decade, there is a progressive decline with advancing age.
In the current study, there is a statistically significant correlation between height and PEFR also. It is observed that with the increase in height by every 1 centimeter, the PEFR value increases by 4-5L/min. This finding is in parallel to the results of the study done by Kodgule RR et al. 15 Thus, from the current study, it is evident that age, gender, and height are the most important determinants of PEFR which is in accordance with existing evidence from previous studies.
Compared to the study done by Nunn EJ et al, the PEFR values for age in males as well as in females are lower in the current study but higher when compared to the Indian studies done by Prasad R et al and Kodgule RR et al. [14,15,19]. The PEFR values for height in males are lower than the study done by Nunn AJ et al and Hankinson JL et al but higher than the study by Prasad R et al and almost like the study by Kodgule RR et al. [14,15,19,20]. The PEFR values for height in females are higher than the study done by Prasad R et al and Kodgule RR et al but lower when compared to the study by Nunn AJ et al. [14,15,19].
The derived regression equations to calculate the predicted PEFR in males and females based on the current study are found to be different from the previous regression equations obtained in other studies. Hence, for comparing the regression equation, we arbitrarily took the age as 35 years, height in males as 170 cm, and height in females as 160 cm. We have observed that the PEFR values in males, as well as in females, are lower as per our regression equation when compared to the study among Europeans by Nunn EJ et al but are higher when compared to the studies in India by Prasad R et al and Kodgule RR et al (Table 3 and Table 4) [14,15,19].
| Predicted PEFR | Current Study | Kodgule RR et al | Nunn AJ et al | Hankinson JL et al | Prasad R et al | |
|---|---|---|---|---|---|---|
| 15 years | Males | 555 | 518 | 538 | 463 | 531 |
| Females | 454 | 357 | 446 | 387 | 446 | |
| 25 years | Males | 520 | 500 | 610 | 571 | 502 |
| Females | 442 | 321 | 480 | 407 | 418 | |
| 35 years | Males | 485 | 482 | 630 | 574 | 472 |
| Females | 429 | 328 | 483 | 448 | 390 | |
| 45 years | Males | 450 | 464 | 621 | 561 | 443 |
| Females | 416 | 314 | 471 | 403 | 362 | |
| 55 years | Males | 415 | 446 | 596 | 533 | 414 |
| Females | 403 | 299 | 450 | 383 | 334 | |
| 65 years | Males | 380 | 428 | 561 | 489 | 385 |
| Females | 390 | 284 | 425 | 351 | 306 | |
Table 3:Comparison of age with predicted PEFR between equations from different studies.
| Predicted PEFR | Current Study | Kodgule RR et al | Nunn AJ et al | Hankinson JL et al | Prasad R et al | |
|---|---|---|---|---|---|---|
| 145 cms | Males | 402 | 402 | 584 | 456 | 388 |
| Females | 364 | 292 | 465 | 360 | 344 | |
| 155 cms | Males | 435 | 434 | 604 | 501 | 422 |
| Females | 407 | 316 | 477 | 394 | 375 | |
| 165 cms | Males | 469 | 466 | 622 | 549 | 455 |
| Females | 450 | 340 | 488 | 430 | 405 | |
| 175 cms | Males | 502 | 498 | 638 | 600 | 489 |
| Females | 493 | 364 | 498 | 468 | 436 | |
| 185 cms | Males | 535 | 530 | 653 | 654 | 522 |
| Females | 536 | 387 | 507 | 508 | 435 | |
Table 4: Comparison of height versus predicted PEFR between equations from different studies.
In India, the current practice is to use 90% of the European Community for Coal and Steel (ECCS) equation, derived for the European population, as the reference values for the spirometry parameters. However, our study suggests that the lung function values of the South Indian population are different from that of Europeans, which implies that the arbitrary application of the correction factor of 90% needs to be reconsidered [21]. We hope that the derived regression equation from this study and the predicted PEFR values so obtained can be a useful tool in the Physician’s armamentarium to evaluate and effectively manage common airway diseases like Bronchial Asthma and Chronic Obstructive Pulmonary Disease on our part of the country.
Strengths and Limitations
In the current study, before obtaining the PEFR measurement, a physical examination was done to eliminate any underlying confounding factors which might contribute to reduced PEFR values. Thus, the derived regression equation for PEFR from our study may be more accurate compared with the previous studies, hence may be used in day-to-day practice.
This study has many limitations. First, this study has been conducted as a single-centre, hospital-based study, and hence, the study population may not be truly representative of the community. The sampling method used in the present study was consecutive sampling, which might have caused a minimal sampling bias also. Lastly, an objective quality criterion for the measured PEFR values was not there, and it might have reduced the reliability of the obtained PEFR values.
Conclusion
In this study, by using a well-calibrated peak flow meter, we derived the regression equations for predicting normal PEFR in the healthy adult population in Central Kerala. The reference equations obtained are as follows:
PEFR in males=41.05 - (3.5 x Age) + (333.7 × Height in cm)
PEFR in females=-213.8 - (1.3 x Age) + (430.3 × Height in cm)
Institutional Ethics Commitee Approval
Yes.
Sources of Support
None.
Conflicts of Interest
None.
References
- Ranu H, Wilde M, Madden B. Pulmonary function tests. Ulster Med J 2011; 80:84-90.
- https://www.nhlbi.nih.gov/files/docs/guidelines/asthsumm.pdf. Accessed Dec 18,2016.
- Maranetra N, Chuaychoo B, Naruman C, et al. The cost-effectiveness of mini peak expiratory flow as a screening test for chronic obstructive pulmonary disease among the Bangkok elderly. J Med Assoc Thailand 2003; 86:1133-1139.
- Tian J, Zhou Y, Cui J, et al. Peak expiratory flow as a screening tool to detect airflow obstruction in a primary health care setting. Int J Tuberc Lung Dis 2012; 16:674-80.
- Talaminos Barroso A, Márquez Martín E, Roa Romero LM, et al. Factors affecting lung function: A review of the literature. Arch Bronconeumol 2018; 54:327-332.
- Braun L. Race, ethnicity and lung function: A brief history. Canadian J Respiratory Therapy 2015; 51:99.
- Wolf C, Staudenherz A, Röggla G, et al. Potential impact of altitude on lung function. Int Arch Occupational Environ Health 1996; 69:106-8.
- Cotes JE, Ward MP. Ventilatory capacity in normal Bhutanese. J Physiol 1966; 186:88-89.
- Singh HD, Subrahmanyam S, Varagunan M. A comparison of peak expiratory flow rates obtained with the Morgan Spirocheck and a mini peak flow meter. Indian J Physiol Pharmacol 1997; 41:91-3.
- Budhiraja S, Singh D, Pooni PA, et al. Pulmonary functions in normal school children in the age group of 6-15 years in north India. Iran J Pediatr 2010; 20:82-90.
- Kamat SR, Tyagi NK, Rashid SS. Lung function in Indian adult subjects. Lung India 1982; 1:11-21.
- Sitalakshmi R, Shankar RP, Padmavathi R, et al. Predicted equations for pulmonary function in normal adolescent south Indian population. Indian J Physiol Pharmacol 2014; 58:290-293.
- Ray D, Rajaratnam A, Richard J. Peak expiratory flow in rural residents of Tamil Nadu, India. Thorax 1993; 48:163-166.
- Prasad R, Verma SK, Agrawal GG, et al. Prediction model for peak expiratory flow in North Indian population. Indian J Chest Dis Allied Sci 2006; 48:103-106.
- Kodgule RR, Singh V, Dhar R, et al. Reference values for peak expiratory flow in Indian adult population using a European Union scale peak flow meter. J Post grad med 2014;123-9.
- Douglas KE, Alasia DD. Evaluation of peak expiratory flow rates (PEFR) of workers in a cerment factory in Port Harcout South-South, Nigeria. Nigerian Health Journal. 2012;12(4):97-101.
- Burge PS, o'Brien IM, Harries MG. Peak flow rate records in the diagnosis of occupational asthma due to colophony. Thorax 1979; 34:308-16.
- Perrin B, Lagier F, l'Archevêque J, et al. Occupational asthma: Validity of monitoring of peak expiratory flow rates and non-allergic bronchial responsiveness as compared to specific inhalation challenge. Eur Respiratory J 1992; 5:40-48.
- Nunn AJ, Gregg I. New regression equations for predicting peak expiratory flow in adults. BMJ 1989; 298:1068–1070.
- Hankinson JL, Odencrantz JR, Fedan KB. Spirometric reference values from a sample of the general U.S. population. Am J Respir Crit Care Med 1999; 159:179-187.
- Aggarwal AN, Gupta D, Behera D, et al. Applicability of commonly used Caucasian prediction equations for spirometry interpretation in India. Indian J Med Res 2005; 122:153-64.
Author Info
Jebu A Thomas1, Sethu Babu2*, Suresh S David3, Krishna Prasad G1, Arjun James2*, Anoop James George4 and Jeny Augustine5
1Department of Emergency Medicine, Luton and Dunstable University Hospital, Luton, United Kingdom2Department of Emergency Medicine, Pushpagiri Institute of Medical Sciences, Thiruvalla, Kerala, India
3Department of Emergency Medicine, Krishna Institute of Medical Sciences, Malkapur, Maharashtra, India
4Department of Emergency Medicine, Jubilee Medical Mission Hospital, Trichur, Kerala, India
5Assistant Surgeon, Family Health Centre, Kadampoor, Alleppey, Kerala, India
Citation: Jebu A Thomas, Sethu Babu, Suresh S David, Krishna Prasad G, Arjun James, Anoop James George, Jeny Augustine, Peak Expiratory Flow Profile among Healthy Adult Individuals in Central Kerala- A Cross-sectional Observational Study , J Res Med Dent Sci, 2021, 9(11): 156-161
Received: 05-Sep-2021 Accepted: 05-Nov-2021


