Research - (2021) Volume 9, Issue 4
Role of High Resolution Ultrasonogram and Elastography in Cervical Lymphadenopathy
Vinothkumar V and Prabakaran M*
*Correspondence: Prabakaran M, Department of Radio Diagnosis, Sree Balaji Medical College & Hospital, Bharath Institute of Higher Education and Research, Chennai, Tamil Nadu, India, Email:
Abstract
To compare the diagnostic accuracy of B mode ultrasonogram, strain and shear wave elastography in differentiating malignant and benign cervical lymph nodes using histopathological examination as the reference standard. To determine the individual and combined role of ultrasonogram, strain and shear wave elastography in differentiating the benign and malignant nature of lymph nodes.
Keywords
Ultrasonogram, Elastography cervical, Lymphadenopathy
Introduction
Enlarged cervical lymph nodes have several causes, such as inflammatory or infectious conditions and malignancy or metastasis. Evaluation of cervical lymph nodes is very essential in patients with head and neck disease. Therefore, it is important in differentiating malignant lymph nodes from benign, as it helps in the assessment of patient’s prognosis and in treatment planning. B‐mode sonography is the primary imaging tool for assessing the size, number, shape, hilum, adjacent tissue reactions, conglomeration and location of cervical lymph nodes. Color Doppler sonography is used to show the vascular distribution in the nodes. However, there are no specific ultrasound criteria for differentiating metastatic lymph nodes from benign nodes with 100% accuracy [1-4].
Fine needle aspiration biopsy is the standard reference method for differentiating metastatic lymph nodes from benign lymph nodes [5,6]. However, there are certain disadvantages like invasive nature, sampling errors and inability to perform on lymph nodes less than 5 mm. Ultrasound elastography is a recently developed non-invasive imaging technique which is based on tissue displacement (i.e., strain) or stiffness in response to applied forces. Ultrasound elastography includes two techniques: strain elastography and shear wave elastography. Malignant tissues show less displacement, whereas benign tissues show more displacement. Thus elastography can help in differentiation of benign and malignant lymph nodes.
Methodology
Approval of the institutional ethical committee was obtained before the start of the study. Permission to receive a histopathological report for correlation from the department pathology was obtained.
Study design
Prospective study, conducted in the Department of Radio diagnosis at Sree Balaji Medical College and hospital, Chennai.
Study period
The study was conducted between the periods of December 2017 to June 2019.
Study population
The study group included those patients with cervical lymphadenopathy who were referred for neck ultrasonography and Doppler analysis to the Radio Diagnosis Department, Sree Balaji Medical College and Hospital.
Sample size
50 patients were included in the study.
Inclusion criteria
✓ Patients with unilateral or bilateral cervical lymphadenopathy who are referred for ultrasonography.
✓Patients with head and neck carcinoma with lymph nodal enlargement.
✓ Patients suspected with cervical lymph node secondaries of unknown primary.
✓ Patients suspected with pulmonary or extra pulmonary lymph nodal tuberculosis.
✓ Patients with reactive cervical lymphadenopathy after a follow-up duration if they do not respond to treatment.
Exclusion criterion
✓ Patients who have received radiotherapy / chemotherapy for cervical lymph node malignancy.
✓ Those who undergo or have completed treatments like ATT.
✓ Those who have undergone surgery such as excision of the cervical lymph node.
✓ Those who have already had cervical lymph node biopsy.
✓ Nodes with large calcific areas that prevent the ARFI box from being placed.
✓ Patients without an inadequate sample or tissue diagnosis.
Statistical analysis
In an excel sheet, the data collected were entered and analyzed using IBM-SPSS analytics technology (version 23.0). Based on the normality of distribution, mean with standard deviation (SD) and interquartile range (IQR) was used for discrete variables such as short axis diameter and short to long axis ratio. Categorical variables such as gender, sides, shape margin, echogenicity, echogenic hilus, calcification, necrosis, other ancillary characteristics, Doppler flow, radiological diagnosis, elastographic pattern, VTI, VTQ and diagnosis of elastography, frequency analysis and percentage analysis were used. Chi-Square test was used to assess the significance of categorical data. All statistical tools were tested at a 5 percent significance level and the probability-p value < 0.05 was considered to be significant.
The receiver operating characteristic (ROC) curves were employed and area under the curve was measured to find the sensitivity, specificity, positive predictive value and negative predictive value on comparison of radiological diagnosis and elastography diagnosis with histopathological examination diagnosis.
Results
Frequency analysis of discrete variables such as age, number of nodes, short node axis and long node axis diameter and short to long axis ratio were determined and the mean, median standard deviation and range of each variable were as follows (Table 1 and Figure 1). Figure 2 shows the distribution of necrotic areas in the nodes. Table 2 distribution of calcification in nodes.
Table 1: Descriptive analysis of continuous variables.
| Vairiables | Age (Years) | No. of Nodes | Short Axis (CM) | Long Axis (CM) | Short/Long Axis Ratio |
|---|---|---|---|---|---|
| N | 50 | 50 | 50 | 50 | 50 |
| Mean | 44.58 | 5.24 | 1.45 | 2.32 | 0.618 |
| Median | 45.5 | 4 | 1.4 | 2.3 | 0.61 |
| Std. Deviation | 15.35 | 3.15 | 0.44 | 0.51 | 0.1255 |
| Range Minimum | 65 | 14 | 1.9 | 2.2 | 0.58 |
| Maximum | 9 | 1 | 0.5 | 1.4 | 0.31 |
| 74 | 15 | 2.4 | 3.6 | 0.89 |
Table 2: Distribution of calcification in nodes.
| Frequency | Percent | |
|---|---|---|
| Present | 1 | 2 |
| Absent | 49 | 98 |
| Total | 50 | 100 |
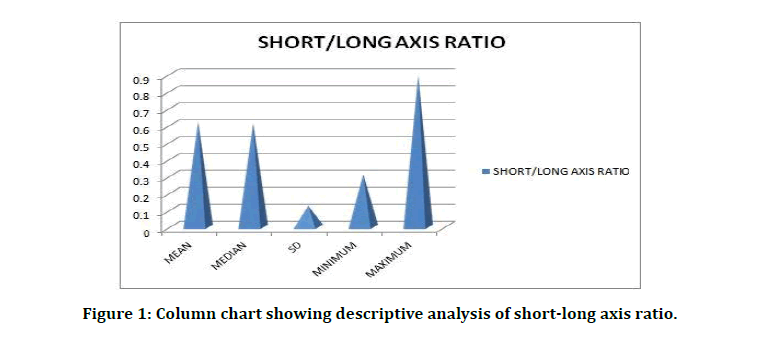
Figure 1: Column chart showing descriptive analysis of short-long axis ratio.
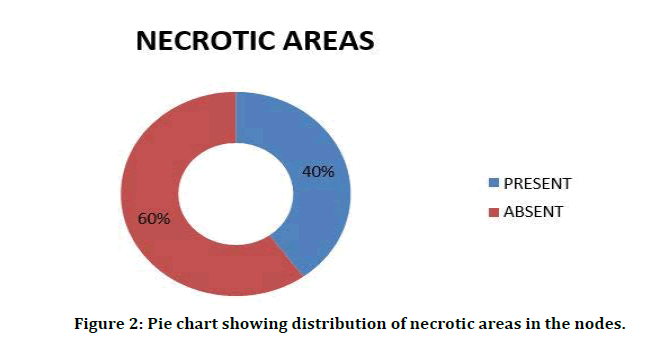
Figure 2: Pie chart showing distribution of necrotic areas in the nodes.
Eccentric cortical hypertrophy
If eccentric cortical hypertrophy is present, it is the sure sign of malignancy. In our study, 5 nodes of patients showed eccentric cortical hypertrophy, which is about 10 percent. The remaining 90% revealed that this feature was absent. Distribution of strain elastographic diagnosis of the nodes is shown in Figure 3. Distribution of HPE reports of nodes is mentioned in Table 3. Distribution of histopathology of malignant nodes is shown in Figure 4.
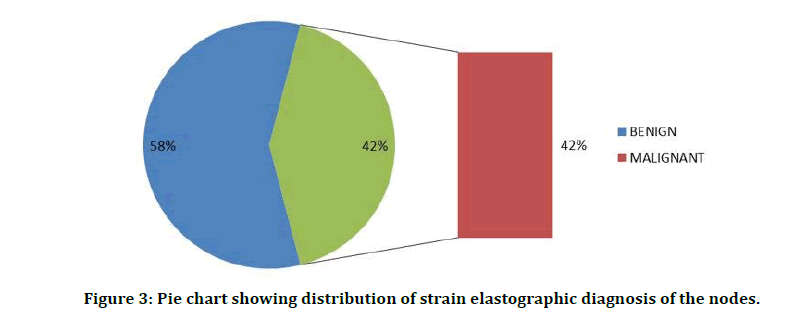
Figure 3: Pie chart showing distribution of strain elastographic diagnosis of the nodes.
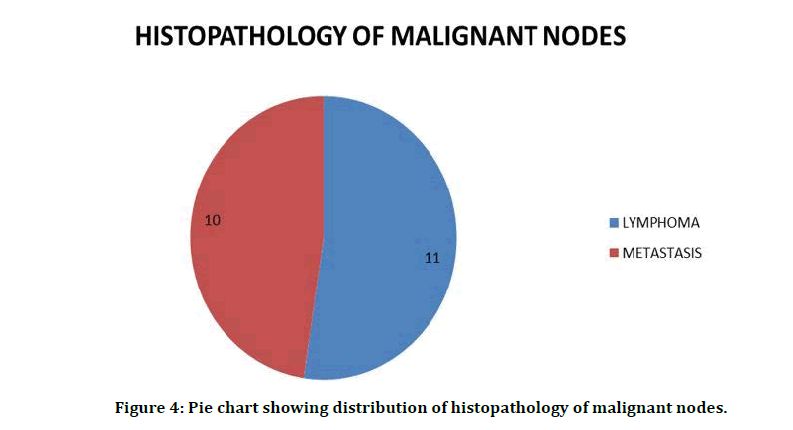
Figure 4: Pie chart showing distribution of histopathology of malignant nodes.
Table 3: Distribution of HPE reports of nodes.
| Frequency | Percent | |
|---|---|---|
| Benign | 29 | 58 |
| Malignant | 21 | 42 |
| Total | 50 | 100 |
Illustrative Cases
The Figure 5 shows benign cervical lymph node and its size and shape. The node is hypoechoic, enlarged and is oval in shape with short to long axis ratio <0.6.
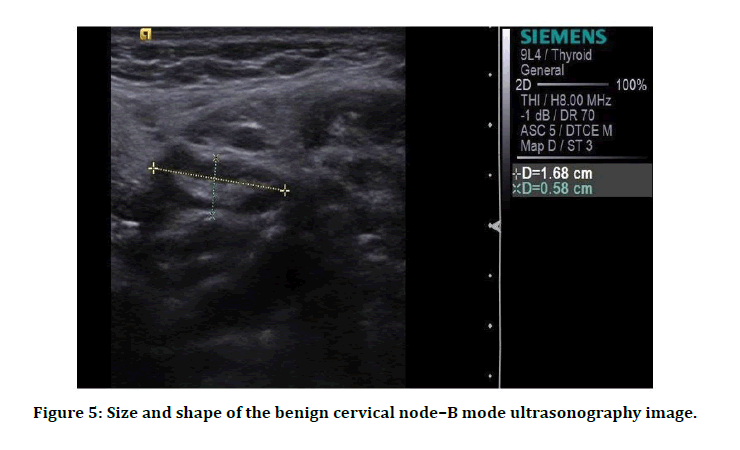
Figure 5: Size and shape of the benign cervical node–B mode ultrasonography image.
Among the 22 malignant nodes diagnosed by ARFI VTQ (SHEAR WAVE VELOCITY), 19 were malignant in HPE and 3 nodes were proved to be benign. Also, among the 28 benign nodes diagnosed by VTQ, 26 were benign and 2 were proved to be malignant (Table 4).
Table 4: VTQ diagnosis versus HPE report cross tabulation.
| HPE Report | ||||
|---|---|---|---|---|
| Benign | Malignant | Total | ||
| VTQ diagnosis | Benign | 26(89.6%) | 2(9.5%) | 28(56%) |
| Malignant | 3(10.4%) | 19(90.5%) | 22(44%) | |
Receiver operating characteristic (ROC) curve
The Receiver Operating Characteristic (ROC) curve analysis was used to determine the sensitivity, specificity, PPV and NPV on comparison of ultrasound diagnosis, elastographic diagnosis, ARFI VTI (BRIGHTNESS) and VTQ (SHEAR WAVE VELOCITY) with HPE. Here malignant nodes were considered as actual positive state and benign nodes as negative state.
The picture shows B-mode ultrasonography and elastographic image of a cervical lymph node. Elastographic image of the node shows predominantly blue in colour with red areas <45%, suggestive of pattern 2-soft node (Figure 6).
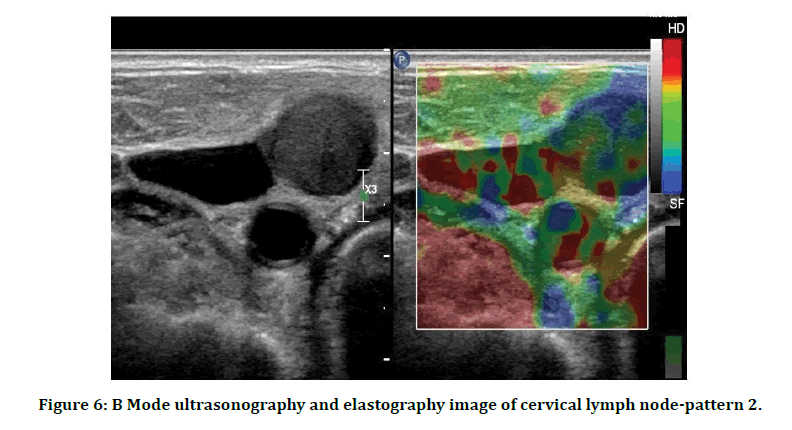
Figure 6: B Mode ultrasonography and elastography image of cervical lymph node-pattern 2.
Table 5 represents case processing summary for roc curve. Smaller values of the test result variable(s) indicate stronger evidence for a positive actual state. The positive actual state is malignant.
Table 5: Case processing summary for roc curve.
| HPE | N |
|---|---|
| Positive | 21 |
| Negative | 29 |
| Total | 50 |
For radiological diagnosis, the ROC curve result showed that the area under the curve was 0.870 which was well above the 0.5 value with a 95% confidence interval between 0.757 and 0.984. As a result, the sensitivity of radiological diagnosis was 80.9 per cent and the specificity was 93.1%. The positive predictive value and negative predictive value were also high, with values of 89.4% and 87.1% with diagnostic accuracy of 88.0% for the diagnosis of malignancy (Figure 7).
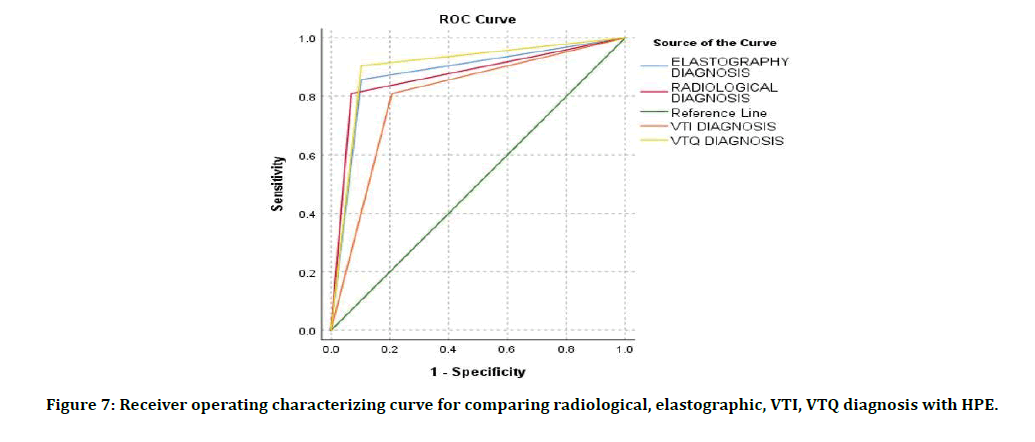
Figure 7: Receiver operating characterizing curve for comparing radiological, elastographic, VTI, VTQ diagnosis with HPE.
HPE: Mucin secreting tall columnar cells arranged individually and in clusters in a mucinous background (Figure 8). HPE: Hypercellular smear composed of monotonous population of lymphocytes predominantly medium sized lymphocytes arranged in monolayered sheets in a non-necrotic and clean background (Figure 9).

Figure 8: Receiver operating characterizing curve for comparing radiological, elastographic, VTI, VTQ diagnosis with HPE.
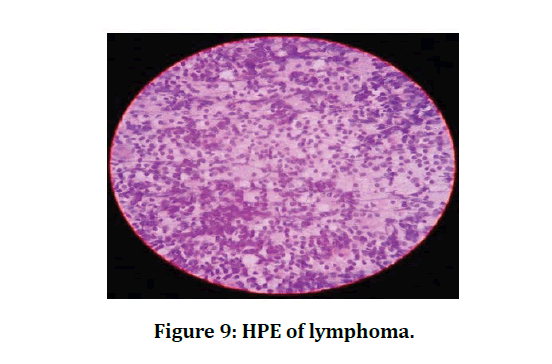
Figure 9: HPE of lymphoma.
For VTI diagnosis, the ROC curve test revealed that the area under the curve was 0.801 which was well over the value of 0.5 with a 95% confidence interval between 0.67 and 0.93. As a result, the sensitivity of the VTI diagnosis was 80.9% and the specificity was 79.3%. The positive predictive value and negative predictive value were 73.9% and 85.1% respectively with diagnostic accuracy of 80.0 % for the detection of malignancy.
For VTQ SHEAR WAVE VELOCITY diagnosis, the outcome of the ROC curve showed that the area below the curve was 0.901, well above the value of 0.5 with a 95% confidence interval between 0.80 and 0.✓. As a result, the VTQ diagnosis sensitivity was 90.4% and the specificity was 89.6%. The positive predictive value and negative predictive value for the diagnosis of malignancy were 86.3% and 92.8% with diagnostic accuracy of 90.0%.
Discussion
We conducted the study with 50 patients with cervical lymphadenopathy who met the criteria for inclusion and exclusion in the Department of Radio diagnosis, Sree Balaji medical college and hospital, Chennai. The participants ' mean age was 44.58 ± 15.35 with a minimum age of 9 years and a maximum age of 74 years. In our study there was a female predominance of 58% with males comprising 42%. In our sample, 50% of patients had right sided disease, 42% were on the left side with only 8% of patients with bilateral disease [7].
In our study population, the number of nodes in a single patient ranged from 1 to a total of 15 with a mean value of 5.24. however, We took a single node from each patient for our analysis, with nodal selection criteria as size–the largest single node has been studied This was because the diagnosis would be the same for a single patient, so if we take all nodes from a single patient, we would not be able to study a variety of pathologies [8].
We examined all the ultrasonographic criteria for each node, including shape, short axis and long axis diameter, short to long axis ratio, echogenicity, margin, hilar, presence or absence and other characteristics like calcification, necrosis, eccentric cortical hypertrophy, matting, and adjacent edema. In their studies on the ultrasound of cervical lymph nodes, Ying M. et al and Farzana Alam.et al have reviewed the above criteria [9].
Also included in our study was the Doppler flow pattern This was comparable with Ying M. et al's study on the ultrasonographic and Doppler criteria of cervical lymphadenopathy [10].
While evaluating the margin of the nodes, using the sharpness of the margin as criteria of malignancy, 80%of the malignant nodes in our research showed a sharp margin. Others have either ill-defined or unsharp margins [11].
The absence of echogenic hilus in the node was either considered malignant or tuberculosis, but its presence is not a criterion for benign nodes. In our research, only 56% of nodes have a hilar absence, although malignant and tuberculous nodes make up 68%. Just 40 percent of nodes displayed the presence of necrotic areas that were considered another criteria for malignancy and tuberculosis compared to 68 percent of the total tuberculous and malignant nodes. Matting of nodes was seen as important criteria for tuberculosis seen in all tuberculosis nodes in our research [12].
Doppler flow has been used as another entity in our study to diagnose malignant nodes. Regular hilar flow was found in 32 % of nodes, including both benign and malignant cases, but peripheral vascularity with or without hilar vascularity was specific to malignancy. Peripheral vascularity was observed in 18 % of nodes and 32 % of nodes reported both peripheral and hilar vascularity. 50% of nodes had peripheral vascularity with or without vascularity in the hilum when combining these two groups. Nevertheless, our study included only 42 % of malignant nodes, which indicated that peripheral vascularity was not a specific malignancy criterion. It was also seen in some inflammatory and reactive nodes. The Doppler characteristics were also analyzed by Mohamed Hefeda et al and Ying. M et al to differentiate benign and malignant nodes [13- 15].
On ARFI VTQ, the mean shear wave velocity of benign lesions was 2.09m/s (± 0.83) and of malignant lesions was 3.2 m/s (± 1.03). Cutoff value of ≥ 2.4 m/sec predicted malignancy with a sensitivity of 90.4%, specificity of 89.6%, accuracy of 90 %, PPV of 86.3% and NPV of 92.8%.
The sensitivity and specificity could be increased to 92% and 96 % respectively when VTI and VTQ were used together. An in-depth analysis showed that although ARFI parameters can accurately differentiate between benign and malignant lymph nodes, the same assertion does not remain true in identifying simple reactive nodal hyperplasia (' leave-alone ' lesions) from other malignant and benign pathologies [16].
The cause for overlap between benign and malignant nodes in U.S. and ARFI findings can be partially due to the high prevalence of tuberculosis in India, reflected in the patient population visiting our set-up, as it was observed in this analysis that tuberculous lymph nodes also showed U.S. and ARFI features identical to neoplastic nodes, also raising the mean nodal stiffness [17]. The sensitivity and specificity could further be increased to ✓.9% and ✓.7% respectively when elastography and sonography were used together. Tuberculosis occurred in a significant proportion of benign lymph nodes (13 out of 29) Lymphoma was the most common etiology of neoplastic process nodal involvement (11 out of 21).
Conclusion
✓ The strain elastography in real-time shows maximum strain on benign lymph nodes and less strain on malignant lymph nodes. Thus with high sensitivity and specificity, it can differentiate benign and malignant cervical lymph nodes. It is operator dependent.
✓ ARFI is a relatively new promising operatorindependent ultrasound- based technique that allows for tissue hardness assessment without external compression.
✓ ARFI parameters have a slight higher diagnostic accuracy in differentiating benign from malignant lymph nodes compared to ultrasonography.
✓ The performance of VTQ was superior to VTI.
✓ Strain and shear wave elastography showed similar overall diagnostic performance in the differentiation between benign and malignant nodes. The sensitivity and specificity in assessing cervical nodes will increase when combining strain and shear wave elastography parameters.
✓ On combining strain and shear wave elastography with B- mode ultrasonogram, the sensitivity to differentiate malignant nodes from benign nodes will increase to 100% and specificity will also be very high.
✓ In the initial work of patients with cervical lymphadenopathy, elastography can be included so that more malignancy may be brought to light.
✓ In the workup of patients with head and neck carcinoma, elastography can be used as an adjunct tool to sonography to characterize the cervical lymph node.
✓ Even though elastography may differentiate malignant nodes from benign nodes, HPE is needed to confirm the diagnosis as it is possible to miss a small percent of malignancy. But it can be used as a guide to select a suitable node for biopsy.
Funding
No funding sources.
Ethical Approval
The study was approved by the Institutional Ethics Committee
Conflict of Interest
The authors declare no conflict of interest.
Acknowledgement
The encouragement and support from Bharath University, Chennai is gratefully acknowledged. For provided the laboratory facilities to carry out the research work.
References
- Hall JE. Guyton and hall textbook of medical physiology Elsevier on vital source. Elsevier Health Sciences 2015; 1171.
- Kumar V, Abbas AK, Fausto N, et al. Pathologic basis of disease. Elsevier Health Sciences 2009; 7658.
- Standring S. Gray’s anatomy: The anatomical basis of clinical practice. Churchill Livingstone/Elsevier 2008; 1551.
- http://www.neurographics.org/2/2/2/2.shtml
- Ioachim HL, Medeiros LJ. Ioachim's lymph node pathology. Lippincott Williams & Wilkins 2008.
- O’Brien CJ, Smith JW, Soong SJ, et al. Neck dissections with and without radiotherapy—prognostic factors, patterns of recurrence and survival. Am J Surg 1986; 152:456–463
- Som PM. Detection of metastasis in cervical lymph nodes: CT and MR criteria and differential diagnosis. Am J Roentgenol 1992; 158:961–969
- Hefeda MM, Badawy ME. Can ultrasound elastography distinguish metastatic from reactive lymph nodes in patients with primary head and neck cancers? Egyptian J Radiol Nuclear Med 2014; 45:715–722.
- Johnson JT, Barnes EL, Myers EN. The extracapsular spread of tumors in cervical nodal metastasis. Arch Otolaryngol Head Neck Surg 1981; 107:725–728.
- Reede DL, Bergeron RT. Cervical tuberculous adenitis: CT manifestations. Radiology 1985; 154:701–704.
- Rouviere H. Anatomy of the human lymphatic system. Edward Brothers 1938.
- Robbins KT. Classification of neck dissection: current concepts and future considerations. Otolaryngol Clin North Am 1998; 31:639-655.
- Shah JP, Strong E, Spiro RH, et al. Surgical grand rounds: neck dissection: current status and future possibilities. Clin Bull 1981; 11:25–33.
- Som Peter M, Curtin Hugh D, Mancuso Anthony A. An imaging-based classification for the cervical nodes designed as an adjunct to recent clinically based nodal classifications. Archives Otolaryngo Head Neck Surg 1999; 125:388396.
- Habermann TM, Steensma DP. Lymphadenopathy. Mayo Clin Proc 2000; 75:723–732.
- Bernard M Karnath. Approach to the patient with lymphadenopathy. Hosp Physician 2005.
- https://jamanetwork.com/journals/jamaotolaryngology/article-abstract/619762
Author Info
Vinothkumar V and Prabakaran M*
Department of Radio Diagnosis, Sree Balaji Medical College & Hospital, Bharath Institute of Higher Education and Research, Chennai, Tamil Nadu, IndiaCitation: Vinothkumar V, Prabakaran M, Role of High Resolution Ultrasonogram and Elastography in Cervical Lymphadenopathy, J Res Med Dent Sci, 2021, 9 (4):249-256.
Received: 20-Mar-2021 Accepted: 08-Apr-2021
