Research - (2021) Volume 9, Issue 6
Ultrasound Evaluation of Kidneys in Chronic Type II Diabetes
M Jayanth and V Chandrasekharm Prabakaran*
*Correspondence: V Chandrasekharm Prabakaran, Department of Radio Diagnosis, Sree Balaji Medical College and Hospital Affiliated to Bharath Institute of Higher Education and Research, Chennai, Tamil Nadu, India, Email:
Abstract
To investigate whether a correlation was found with various clinical stages of the disease and sonographic findings by using Duplex Doppler Ultrasound. To assess whether increased renal vascular resistance in asymptomatic patients correlated with mild renal functional impairment. It is well known that the prevalence of type 2 diabetes is expanding its territory all over the world with no realms. The additional fact that increased toll of mortality due to cardiovascular diseases and end-stage renal diseases which has been profoundly correlated with the most prevalent disease condition is also encroaching an alarming state. In numbers, there were an estimated 422 million adults who were diagnosed with diabetes in the year 2014. Overall, none of the patients had acquired cystic kidney disease. In this study it was found that most of type 2 diabetic patients with Chronic Renal Failure had "small kidneys".
Keywords
Diabetes, Ultrasound, Dyslipidaemia, Nephropathy
Introduction
It is well known that the prevalence of type 2 diabetes is expanding its territory all over the world with no realms. The additional fact that increased toll of mortality due to cardiovascular diseases and end-stage renal diseases which has been profoundly correlated with the most prevalent disease condition is also encroaching an alarming state. In numbers, there were an estimated 422 million adults who were diagnosed with diabetes in the year 2014 which was four times higher than that in the 1980s [1,2]. India well known as the "diabetic capital" has the largest proportion of diabetics in the general population pushing back China and United States to the second and third positions in the 21st century beginning. Currently there were 62 million of them burdening this country with the silent killer disease [3]. Chronic kidney diseases with its correlates parallel to that of diabetes was affecting about 11% of the population of United States and globally the tally will be equivalent to more than 50 million people [4,5]. The deadly correlation has been portrayed in one study wherein 45% of those who receive dialysis, diabetes remained a primer in to cause renal failure [6]. Those with moderate to severe CKD were diabetic in about 23% of the patients [6,7]. This is in addition to the condition poor prognosis for rehabilitation and survival in the diabetic and uraemic patients.
The proteinuria which occurs as a complication to diabetes which when follows the disappearance of glucosuria, the fatal outcome is mostly decisive. Microalbuminuria is when albumin excretion rate is 20 -200 μg per minute. When macro-albuminuria occurs (an excretion of >300 mg per day) patients are also prone for hypertension that will manifest itself. This further progresses to ESRF and this is also dependent on both genetic and environmental factors as well. This incipient progression can be recognized with the help of other laboratory tests like urinary albumin excretion (UAE), the upper limit of which is 30 mg per 24 hours or 20 μg per min. Other factors like creatinine clearance, dyslipidaemia in addition to urinary tract infection, heart failure or fever has also to be evaluated as it may confound the results [8].
The Diabetes and Chronic Kidney Disease work group of the National Kidney Foundation Kidney Disease Outcomes Quality Initiative (KDOQI) has suggested that a diagnosis of CKD presumed to be caused by diabetes shall be referred as "diabetic kidney disease" or DKD and the term diabetic nephropathy shall be attributed to diabetes with histopathlogical injury that has been evidenced by renal biopsy [9]. CKD, is defined as either kidney damage or decreased kidney function for ≥3 months [10]. Staging of CKD has five levels grouped by kidney function as described by the estimated glomerular filtration rate (eGFR).
Despite the disparity of explicitness in the definitions for Diabetic Kidney Disease and its clinical and radiological correlations, this hospital based study was undertaken for identification of the role of Duplex Doppler Ultrasonography in detecting the disease prognosis, in addition to the hunt for relevance of the clinical condition with radiological parameters. In this reign of scientific research, our study might help bridge the gaps in knowledge about diabetic nephropathy especially the betterment of Duplex Doppler ultrasound over the conventional ultrasonography that has limited sensitivity and specificity in detection of ongoing disease process and prognosis as well [11,12].
The diagnosis when made much earlier, the more will be the time saved in treating the condition and thence the positivity in mental health that results out of cure. In addition there remain a large lacunae of evidences divulging the relationships of male obesity and infertility in our country [13]. Therefore in this study the prevalence of altered semen parameters in men with abnormal BMI will be computed and compared with that of normal BMI men.
Materials and Methods
The current study was Hospital-based comparative crosssectional study.
Inclusion criteria
- Diabetics aged more than 18 years of age who give consent for the study.
- Biochemically diagnosed for nephropathy in cases group.
Exclusion criteria
- Any secondary causes or co-morbid conditions.
- Previously diagnosed renal anomalies and chronic renal diseases.
- Treated for any known renal pathology in last 1 year.
Study period
The data collection for the study was done between April 2017 to October 2018.
Study procedure
After obtaining the informed written consent, all the study participants were evaluated by detailed clinical history, physical and radiological examination.
Study tool
Real time gray scale ultrasound was performed with logic 3, LSD 30269WS5, General electric, USA system with 3.5 MHZ curve linear transducer with a wide 7 cm contact surface.
Statistical methods
Descriptive statistics: Descriptive analysis was carried out by mean and standard deviation (SD) as well as median and interquartile range (IQR) for quantitative variables, frequency and proportion for categorical variables. Data was also represented using appropriate diagrams like bar diagram, pie diagram and box plots.
Inferential statistics: The association between explanatory variables and Doppler findings was assessed by cross tabulation and comparison of percentages. Pearson's chi square test, Fisher's exact test, one way ANOVA with post-hoc test of LSD were used to test for the statistical significance.
P value < 0.05 was considered statistically significant.
IBM SPSS version 22 was used for statistical analysis.
Ethical considerations
Clearance was obtained from ethical committee of Sree Balaji Medical College, Chennai.– Tamilnadu for the study, written and informed consent was sought from the patients and their attendants. They were given the option of quitting from study if so desired by them. No element of compulsion was exerted. All data was kept confidential.
Results
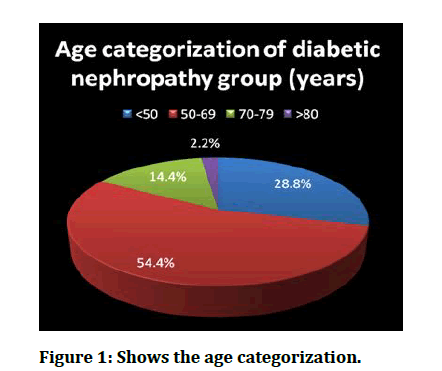
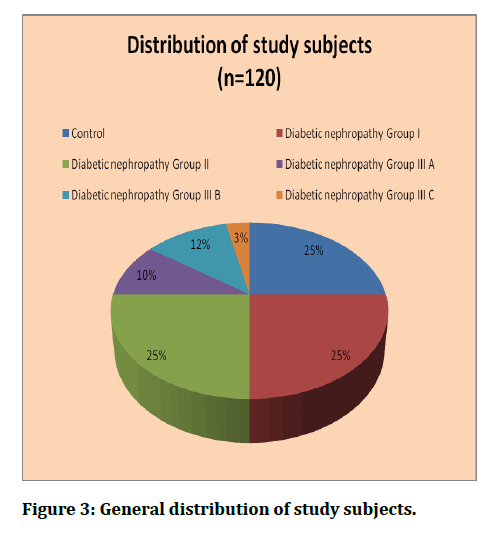
The prospective observational study was conducted by following-up 120 diabetic subjects, grouped into controls (n=30) patients and cases (n=90) diagnosed to have diabetic nephropathy clinically and radiologically, attending to the department of Radiodiagnosis for evaluation and treatment. The mean age of the study participants was 56.4 ± 10.8 years for controls and 58.7 ± 11.5 years for cases. The age distribution is given in Table 1 and Figure 1.
Figure 1: Shows the age categorization.
Table 1: Age distribution of study subjects.
| Age (in years) | p-value | ||
|---|---|---|---|
| Groups | Mean | SD | |
| Controls (n=30) | 56.4 | 10.8 | 0.12 |
| Cases (n=90) | 58.7 | 11.5 | |
Independent t-test used; p-value <0.05 is significant.
The Table 2 and Figure 1 shows the categorization of age among the diabetic nephropathy group. It was found that, maximu m of the patients were falling under 50-69 age groups (54.4%) that was followed by persons aged <50 years (28.8%) and only 2 persons belonged to age group >80 years. This difference in distribution was statistically significant. Non parametric chi square equation was used giving χ2 =15.6 and associated p-value <.001.
Table 2: Age categorization of the cases (Diabetic nephropathy).
| Age categories (in years) | Frequency | Percentage | 15.6 | p-value |
| <50 | 26 | 28.8 | ||
| 50-69 | 49 | 54.4 | ||
| 70-79 | 13 | 14.4 | ||
| >80 | 2 | 2.2 | ||
| Total | 90 | 100 |
Non-parametric chi-square test used; p-value<.05 is significant.
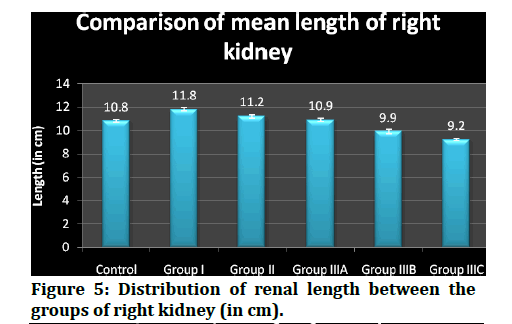
The median (50th percentile) renal length (inter- quartile range, i.e between 25th percentile and 75th percentile) fluctuated with values of 10.9 ( 10.8, 11.0), 11.9 (11.7, 12.0), 11.3 (11.1, 11.4), 11.0 (10.9, 11.1), 10.0 (9.9, 10.02) and 9.2 (9.12, 9.27) respectively among controls, group I, group II, group IIIA, group IIIB, group IIIc that have been included in this study.
The interpretation is that the length diminished while the disease was getting progressed and was projected. The median (50th percentile) renal length (inter- quartile range, i.e between 25th percentile and 75th percentile) fluctuated with values of 13.9 ( 13.8, 14.0), 15.0 (14.9, 15.1), 14.15 (15.0, 14.3), 13.5 (13.4, 13.67), 12.05 (11.9, 12.27) and 10.3 (10.22, 10.3) respectively among controls, group I, group II, group IIIA, group IIIB, group IIIc that have been included in this study.
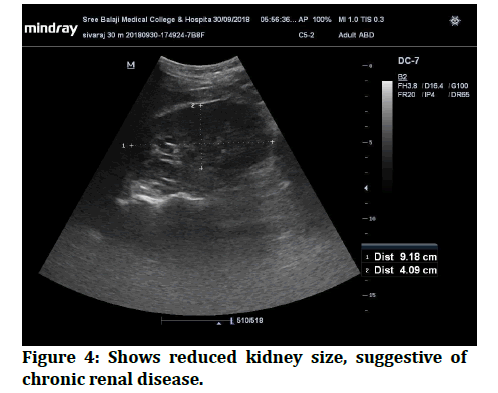
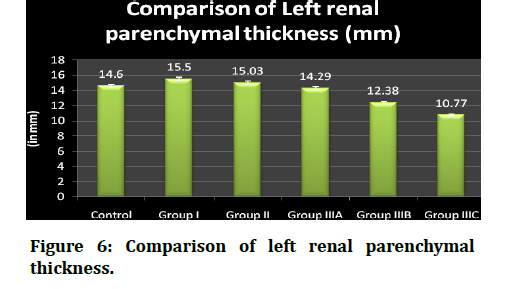
The interpretation is that the renal parenchymal thickness diminishes as the disease was getting progressed and was projected in figure 4. Table 4 shows the distribution of renal parenchymal thickness between the groups of right kidney. The range, mean and standard deviations, median and inter-quartile range were displayed. The statistical analysis used h ere was one-way ANOVA with LSD post-hoc testing done. The mean and SD of controls, group I, group II, group IIIA, group IIIB, group IIIc were 14.6 ± .19, 15.5 ±.23, 15.03 ±v 21, 14.29 ± .20, 12.38 ± .13, 10.7 ± .09 millimeters respectively.
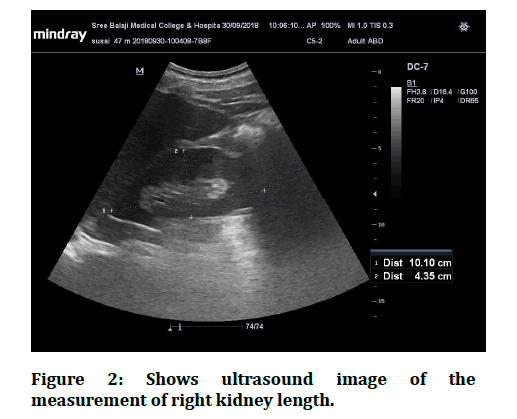
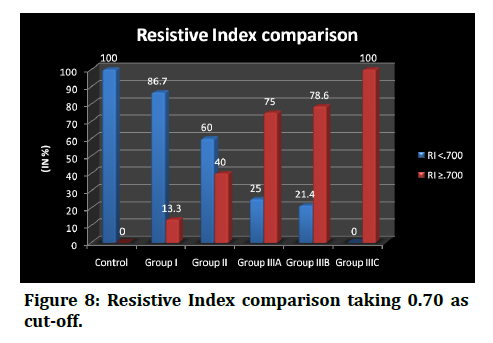
Their lengths ranged from 13.7 to 14.3, 14.0 to 15.3, 13.8 to 14.4, 13.2 to 14.3, 11.8 to 13.5 and 10.2 to 10.4 among the controls, group I, group II, group IIIA, group IIIB, group IIIc respectively. proportion of subjects in RI ≥ 0.70 group was higher in diabetic nephropathy group IIIA, group IIIB, group IIIC than the RI <0.70 group and the values are as follows, 75.0% vs 25.0%, 78.6% vs 21.4%, 100.0% vs 0.0% respectively. The difference in proportion was found to be statisticallysignificant.(p<. 001) (Figure 2 to Figure 8 and Table 3).
Figure 2: Shows ultrasound image of the measurement of right kidney length.
Figure 3: General distribution of study subjects.
Figure 4: Shows reduced kidney size, suggestive of chronic renal disease.
Figure 5: Distribution of renal length between the groups of right kidney (in cm).
Figure 6: Comparison of left renal parenchymal thickness.
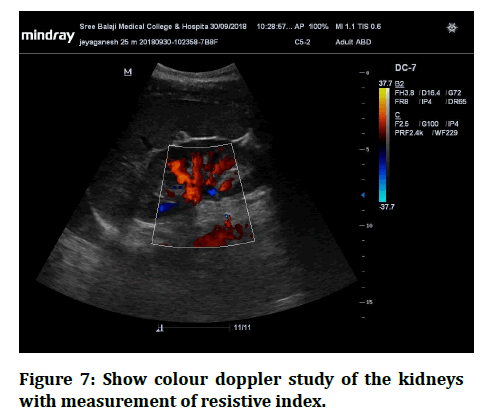
Figure 7: Show colour doppler study of the kidneys with measurement of resistive index.
Figure 8: Resistive Index comparison taking 0.70 as cut-off.
Table 3: Distribution of Renal parenchymal thickness for Right Kidney (in mm).
| Groups | Min | Max | Mean | SD | Median | IQ Range |
|---|---|---|---|---|---|---|
| Control | 13.7 | 14.3 | 13.9 | 0.17 | 13.9 | 13.8, 14 |
| Diabetic nephropathy Group I | 14 | 15.3 | 14.9 | 0.3 | 15 | 14.9, 15.1 |
| Diabetic nephropathy Group II | 13.8 | 14.4 | 14.1 | 0.28 | 14.15 | 15.0, 14.3 |
| Diabetic nephropathy Group III A | 13.2 | 14.3 | 13.5 | 0.23 | 13.5 | 13.4, 13.67 |
| Diabetic nephropathy Group III B | 11.8 | 13.5 | 12.2 | 0.47 | 12.05 | 11.9, 12.27 |
| Diabetic nephropathy Group III C | 10.2 | 10.4 | 10.3 | 0.1 | 10.3 | 10.22, 10.3 |
One-way ANOVA with LSD post-hoc test used; F-value=371.7, p<.001
Discussion
In kidney diseases, ultrasonography is used as a first - line imaging technique, and its role in medical nephropathy is to exclude urological pathologies, to differentiate between acute and chronic renal failure, to follow-up on the course of a disease, to guide needle biopsy, etc. Our study has overall portrayed the utility of ultrasonography in diagnosing DKD and its clinical relevance [14,15]. The mean age of the study participants was 56.4 ± 10.8 years for controls and 58.7 ± 11.5 years for cases. The age group of controls and cases were not significantly differing from each other. The age group of our study participants were comparable with the Sudanese diabetic patients between the mean of ages was 57.6 years [13]. This was relatively low when compared to study from Yokoyama et al. [16] where the mean age was 73 years. It was found that, maximum of the patients were falling under 50 -69 age groups (54.4%) that was followed by persons aged <50 years (28.8%) and only 2 persons belonged to age group >80 years.
The right kidney, the mean length (centimeters) and SD of controls, group I, group II, group IIIA, group IIIB, group IIIc were 10.8 ± .11, 11.8 ±.14, 11.2 ± .15, 10.9 ± .15, 9.9 ± .18, 9.2 ± .08 respectively. Their len gths ranged from 10.7 to 11.1, 11.6 to 12.1, 10.9 to 11.5, 10.7 to 11.2, 9.8 to 10.1 and 9.1 to 9,3 among the controls, group I, group II, group IIIA, group IIIB, group IIIc respectively. The median (50th percentile) renal length (inter-quartile range, i. e between 25th percentile and 75th percentile) fluctuated with values of 10.9 (10.8, 11.0), 11.9 (11.7, 12.0), 11.3 (11.1, 11.4), 11.0 (10.9, 11.1), 10.0 (9.9, 10.02) and 9.2 (9.12, 9.27) respectively among controls, group I, group II, group IIIA, group I IIB, group IIIc that have been included in this study.
The mean kidney length was (14.5 cm) was higher in diabetic patients of one study [17], which is contrary to that of our study subjects. This might be explained due to that there are differences in ethnicity between the groups as well as the duration of diabetes that will be differing in both the groups.
Having most of the studies, dealing the renal length with progression of the disease, there was an interesting study which correlated the length with the type of diabetes which found was a significantly higher proportion of larger kidneys (11 cm or more) in the IDDM group than in the NIDDM group [18].
Even they postulated that the mean length of kidneys were inversely related to the serum creatinine levels as was the correlation observed in our study.
The renal parenchymal thickness between the groups of left kidney was evaluated. The range, mean and standard deviations, median and inter-quartile range were decimated.
The mean and SD of controls, group I, group II, group IIIA, group IIIB, group IIIc were 14.6 ± .19, 15.5 ±.23, 15.03 ± .21, 14.29 ± 0.20, 12.38 ± 0.13, 10.7 ± 0.09 millimeters
Respectively. Their parenchymal thickness ranged from 13.7 to 14.3, 14.0 to 15.3, 13.8 to 14.4, 13.2 to 14.3, 11.8 to 13.5 and 10.2 to 10.4 among the controls, group I, group II, group IIIA, group IIIB, group IIIc respectively. The median (50th percentile) parenchymal thickness (inter- quartile range, i.e between 25th percentile and 75th percentile) fluctuated with values of 14.6 (14.5, 14.72), 15.6 (15.4, 15.7), 15.0 (14.9, 15.2), 14.25 (14.12, 14.47), 12.4 (12.3, 12.5) and 10.75 (10.7, 10.87) respectively among controls, group I, group II, group IIIA, group IIIB, group IIIc that have been included in this study.
In addition to it, there were significantly high correlations of RI with the proteinuria [19]. Supporting this, Shirin M et al. [20] have observed a positive correlation between resistive index with serum creatinine (r=0.581, p<0.01) and albuminuria (r-0.725, p<0.01). The median RI was found to be less than 0.70 in the control group, group I and group II. The values raised >0.70 in the group III and the subgroup findings showed, the higher resistive index in group IIIC which was >0.80 and was comparable between group IIIA and group IIIB with the former group having slightly higher values than the later. The advancement of the disease would raise the resistance of the renal arteries being supplied. On the resistive index values, the subjects were compared for RI <0.70 and RI ≥ 0.70 and fisher's exact test was used to find if there were any statistically significant difference between the groups. It was found that the proportion of RI <0.70 was higher in the controls, group I and group II against the RI ≥ 0.70 group with the values as follows, 100.0% vs 0.0%, 86.7% vs 13.3%, 60.0% vs 40.0% respectively. Contrarily, the proportion of subjects in RI ≥ 0.70 group was higher in diabetic nephropathy group IIIA, group IIIB, group IIIC than the RI <0.70 group and the values are as follows, 75.0% vs 25.0%, 78.6% vs 21.4%, 100.0% vs 0.0% respectively.
The difference in proportion was found to be statistically significant.(p<.001) In concurrence with this, Soldo et al. [21] have also proposed that Resistive indices correlated well with renal function, and pathologic values were observed in 15% in the asymptomatic group and in 87% in the group with advanced nephropathy.
Sari et al. [22] in a study have compared the renal arterial RI of the diabetics (0.79+/-0.07) with the healthy persons and have found a significantly higher resistive index in diabetics than the healthy individuals (0.61+/-0.04) that was also similar to the results of another study [23].
Conclusion
Ultrasonographic evaluation of the kidney size is a useful method for assessment of the progression and in some cases the type of nephropathy. Diabetic nephropathy in type 2 diabetes is not only the cause of chronic renal failure (CRF), but also non-diabetic renal diseases. Besides giving the clinical picture, USG evaluation can be useful for qualification of the main cause of CRF in type 2 diabetes patients and other non-diabetic causes will also have to be simultaneously evaluated in order to improve the quality of life of the patients saving the time getting delayed in specific diagnosis.
Overall, none of the patients had acquired cystic kidney disease. In this study it was found that most of type 2 diabetic patients with Chronic Renal Failure had "small kidneys" which means that they had ischemic, hypertonic or inflammatory nephropathy accompanying type 2 diabetes.
Funding
No funding sources.
Ethical Approval
The study was approved by the Institutional Ethics Committee.
Conflict of Interest
The authors declare no conflict of interest.
Acknowledgements
The encouragement and support from Bharath University, Chennai is gratefully acknowledged. For provided the laboratory facilities to carry out the research work.
References
- Coresh J, Astor BC, Greene T, et al. Prevalence of chronic kidney disease and decreased kidney function in the adult US population: Third national health and nutrition examination survey. Am J Kidney Dis 2003; 41:1–12.
- Middleton RJ, Foley RN, Hegarty J, et al. The unrecognized prevalence of chronic kidney disease in diabetes. Nephrol Dialysis Transplantation 2006; 21:88-92.
- Afkarian M, Zelnick LR, Hall YN, et al. Clinical manifestations of kidney disease among US adults with diabetes, 1988 -2014. JAMA 2016; 316):602–610.
- Orchard TJ, Dorman JS, Maser RE, et al. Prevalence of complications in IDDM by sex and duration: Pittsburgh Epidemiology of Diabetes Complications Study II. Diabetes 1990; 39:1116-24.
- Newman DJ, Mattock MB, Dawnay ABS, et al. Systematic review on urine albumin testing for early detection of diabetic complications. Health Technol Assess 2005; 9.
- O’Neill WM, Wallin JD, Walker PD. Hematuria and red cell casts in typical diabetic nephropathy. Am J Med 1983; 74:389–95.
- Cosby KS, Kendall JL. Practical guide to emergency ultrasound. Lippincott Williams & Wilkins 2006.
- https://www.elsevier.com/books/diagnostic-ultrasound-general-adult/rumack/978-1-4557-5982-8
- Emamian SA, Nielsen MB, Pedersen JF, et al. Sonographic evaluation of renal appearance in 665 adult volunteers: correlation with age and obesity. Acta Radiol 1993; 34:482-485.
- Emamian SA, Nielsen MB, Pedersen JF. Tenth percentiles of kidney length in adult volunteers. Am J Roentgenol 1994; 163:748–748.
- O’Neill WC. Renal relevant radiology: Use of ultrasound in kidney disease and nephrology procedures. Clin J Am Soc Nephrol 2014; 9:373 –81.
- Dinkel E, Ertel M, Dittrich M, et al. Kidney size in childhood. Sonographical growth charts for kidney length and volume. Pediatr Radiol 1985; 15:38–43.
- Kadioglu A. Renal measurements, including length, parenchymal thickness, and medullary pyramid thickness, in healthy children: What are the normative ultrasound values? Am J Roentgenol 2010; 194:509–515.
- Haller JO, Berdon WE, Friedman AP. Increased renal cortical echogenicity: A normal finding in neonates and infants. Radiology 1982; 142:173–4.
- Tublin ME, Bude RO, Platt JF. The Resistive Index in renal doppler sonography: Where do we stand? Am J Roentgenol 2003; 180:885–892.
- Elseid M, Edam GA. Ultrasonographic characteristics of diabetes impacts in kidneys’ morphology. Open J Radiol 2014; 4:301–308.
- Platt JF. Doppler ultrasound of the kidney. InSeminars in Ultrasound, CT and MRI. WB Saunders 1997; 18.
- American Diabetes Association. Standards of medical care in diabetes. Diabetes Care 2005; 28:S4–S36.
- Kasiske BL. Laboratory assessment of renal disease: clearance, urinalysis, and renal biopsy. Kidney 2000.
- Cockcroft DW, Gault H. Prediction of creatinine clearance from serum creatinine. Nephron 1976; 16:31–41.
- Worrall JG, Phongsathorn V, Hooper RJ, et al. Racial variation in serum creatine kinase unrelated to lean body mass. Rheumatol 1990; 29:371-373.
- Friedman R, de Azevedo MJ, Gross JL. Use of the serum creatinine to estimate glomerular filtration rate in health and early diabetic nephropathy. Am J Kidney Dis 1991; 17:725–726.
- Rule AD, Larson TS, Bergstralh EJ, et al. Using serum creatinine to estimate glomerular filtration rate: accuracy in good health and in chronic kidney disease. Ann Intern Med 2004; 141:929–937.
Author Info
M Jayanth and V Chandrasekharm Prabakaran*
Department of Radio Diagnosis, Sree Balaji Medical College and Hospital Affiliated to Bharath Institute of Higher Education and Research, Chennai, Tamil Nadu, IndiaCitation: M Jayanth, V Chandrasekharm Prabakaran, Ultrasound Evaluation of Kidneys in Chronic Type II Diabetes, J Res Med Dent Sci, 2021, 9(6): 117-122
Received: 03-Apr-2021 Accepted: 14-Jun-2021 Published: 21-Jun-2021

