Research - (2022) Volume 10, Issue 9
Variation of Cortical Structures of Frontal Lobes in Different Sudanese Tribes
Wegdan Ahmed1, Tahir Osman Ali2, Bunyamin Sahin3, Samy Ismail4, Mohammed H Karrar Alsharif5* and Amani Elfaki1
*Correspondence: Mohammed H Karrar Alsharif, Department of Basic Medical Sciences, College of Medicine, Prince Sattam Bin Abdulaziz University, Al-Kharj, 11942, Saudi Arabia, Email:
Abstract
Background: To date, there is no study has addressed the effect of race on cortical thickness (CT), cortical area pial (CAP), and the surface fraction of cortical area pial (SFCAP). The present study aimed to provide an overview about similarities and differences in CT, CAP, and SFCAP of the hemisphere, frontal lobe, and frontal lobe gyri between males and females of Sudanese tribes. Methodology: The present study included 139 healthy Sudanese subjects (80 males and 59 females); their ages ranged between 20 and 40 years. The subjects were assigned to six tribes: Jaalayin, Juhyna “1”; Nubians, Beja, Juhyna “2”; and Non-Arabian tribes. T1-weighted MR brain images with a thickness of 1mm were obtained. MR images of the subjects were analyzed using the automatic segmentation software (BrainSuite). CT, CAP, and SFCAP of the hemisphere, frontal lobe, and frontal lobe gyri were estimated using the output data of the process of software. Result: CT of the hemisphere, frontal lobe, and frontal lobe gyri were not significantly different between Sudanese tribes. CAP of the hemisphere, frontal lobe, cingulate gyrus, superior frontal gyrus, precentral gyrus, pars orbitalis, pars orbitalis, orbitofrontal gyri, and middle frontal gyrus; were significantly different between Sudanese tribes. SFCAP of the cerebral hemispheres, frontal lobes, and most frontal lobe gyri were not significantly different between Sudanese tribes, while precentral, middle frontal gyrus, and pars triangularis were significantly different between Sudanese tribes. Conclusion: CT and SF-CAP were not different between Sudanese tribes, while CAP was different between Sudanese tribes.
Keywords
Cortical thickness, Cortical area pial, Surface fraction, Magnetic Resonance Imaging, Brain suite
Introduction
The cerebral hemispheres are the largest parts of the brain concerned with higher-order functions such as thought, judgment, memory, foresight, and planning. Each cerebral hemisphere consists of several lobes; the largest lobe is the frontal lobe, which is associated with movement, speech, and higher aspects of cognitive function and contributes to personality [1,2].
The cerebral hemispheres consist of the external cortex of grey matter and the internal mass of white matter. The cerebral cortex has a folded sheet appearance with the following areas on its’ surface: The inner surface (the grey matter/white matter interface) and the pial surface (the grey matter/cerebrospinal fluid (CSF) interface) [3]. The three-dimensional space between the inner and pial surfaces is defined as the cortical thickness [4] (Figure 1).
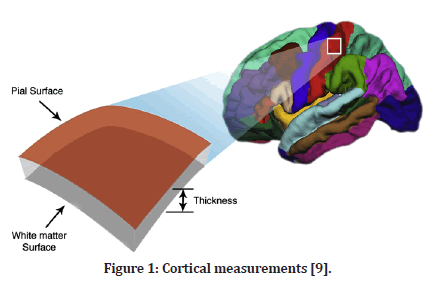
Figure 1: Cortical measurements [9].
Measuring the cortical thickness and cortical pial area using magnetic resonance (MR) images is a relatively new technique, and there are few studies on normal and abnormal subjects. That is because it is very difficult to extract the cortex, where the fine details of sulcal anatomy are often obscured. In addition to that, manual segmentation is very difficult due to the need to create a correct cut plane perpendicular to the surface. The present study used automated software (BrainSuite) to extract the cerebral cortex and automatically calculate each gyrus's cerebral hemisphere's cortical area, pial and cortical thickness.
Previous studies have demonstrated that the cortical thickness and cortical pial area are affected by many factors, such as age and gender [5-8]. However, there has not been any study that addressed the effect of race on these cortical structures. The goal of the present study was to measure the cortical thickness, cortical pial area, and cortical pial area of the cerebral hemispheres, frontal lobes, and frontal lobe gyri in the main Sudanese tribes (Jaalayin, Juhyna “1”, Juhyna “2”, Nubians, Beja, and Non- Arabian tribes); thereby discovering the similarities and differences in these cortical structures between Sudanese tribes.
Material and Methods
Subjects
The current study included 139 healthy young adult Sudanese subjects aged between 20 and 40 years. The subjects were assigned to the following Sudanese tribes: Jaalayin; Juhyna “1”; Nubians; Beja; Juhyna “2”; and Non- Arabian tribes. The majority of subjects who participated in this study were from the Jaalayin tribes, while the least participants were from Juhyna “2” tribes (Figure 2).
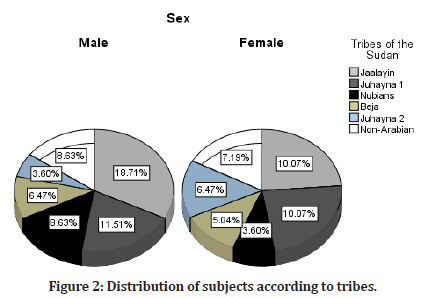
Figure 2: Distribution of subjects according to tribes.
The participants were not included if they had a history of or were currently using recreational drugs. Subjects with head trauma, neurological diseases, psychiatric diseases, or congenital malformation related to the brain were also excluded. The present study was approved by the Ethical Committee of the National Ribat University.
Magnetic resonance imaging
Three-dimensional T1-weighted MR brain pictures were acquired using a 1.5 Tesla Philips scanner, Version: 3.2.1, in 5 minutes and 18 seconds, with a slice distance of 1.0mm, a field of view of 250 read, 192mm phase, TR=1657ms, TE=2.95ms, bandwidth 180Hz/pixel, flip angle 15°, and ECHO spacing=7.5ms.
MR images analysis
Brain suite software tools, which automatically process the MR image of the brain, were used to examine the MR images. Surface and volume registration and cortical surface extraction sequence (CSE) are the two processes used by the Brain Suite to evaluate MR images. These procedures take about three hours to complete.
Cortical Surface Extraction Sequence (CSE)
The skull and scalp are stripped from the MR picture during this 30-minute stage, followed by correcting an error that occurred during the skull removal. Following a classification of the brain's tissue into white matter, grey matter, and cerebrospinal fluid, the program divides the brain into its three main regions: the cerebrum, cerebellum, and brainstem. The mistake is fixed by removing the cortex from the affected brain hemisphere. Finally, the pial surface is generated, and each hemisphere's cortical surface is displayed in a separate hue. http://brainsuite.org/ (Figure 3).

Figure 3: Cortical surface extraction sequence.
Surface and Volume Registration (SV Reg)
During this step, the cortical and subcortical structures also label the surfaces, and volumes are registered to the brain atlas. The output of BrainSuite in an excel sheet containing the measurement of each brain gyri, such as grey matter volume, white matter volume, CSF volume, cortical area pial, midal, inner, and cortical thickness (Figure 4).
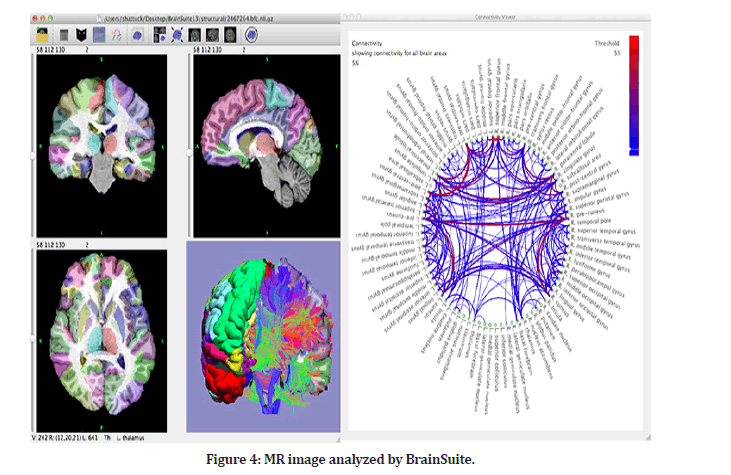
Figure 4:MR image analyzed by BrainSuite.
BrainSuite automatically calculates cortical thickness (CT), cortical area pial (CAP), and the surface fraction of cortical area pial (SFCAP) of gyri of the cerebral hemispheres. To calculate CT, CAP, and CAP of the cerebral hemisphere and frontal lobe, the following formulas (1- 5) were used in the Microsoft excel worksheet.
Formula 1: CT of the cerebral hemisphere= Σ CT of cerebral gyri
Formula 2: CT of the frontal lobe= Σ CT of frontal lobe gyri
Formula 3: CAP of the cerebral hemisphere= Σ CAP of cerebral gyri
Formula 4: CAP of the frontal lobe = Σ CAP of frontal lobe gyri
Formula 5: Surface fraction of the frontal lobe= Ss (X,Y) = AX in AY/Ay
Where the Ax indicates a surface area of the X phase and Ay is the surface area of the reference space Y, Ss (frontal lobe, cerebral hemisphere).
Statistical analysis
Data were analyzed using Statistical Package of Social Science (SPSS) version 21.0. Kruskal-Wallis Test was used to compare the variables of the regions of interest (ROI) across males and females Sudanese tribes.
Results
Cortical thickness (CT)
CT of the hemispheres, frontal lobes, and frontal lobe gyri were not different (P>0.05) across the males and females of Sudanese tribes.
Cortical Area Pial (CAP)
CAP of the right hemisphere was larger in males of Juhyna “1” than in Non-Arabian tribes (P<0.05) (Figure 5). CAP of the left and entire hemispheres were larger in males of Nubians than in Juhyna “2” tribes (P<0.05) (Figures 6 and 7). However, CAP of the right, left, and total hemispheres were not different from other Sudanese tribes (P>0.05).

Figure 5:Pairwise comparison of CAP of the right hemisphere across males of Sudanese tribes.
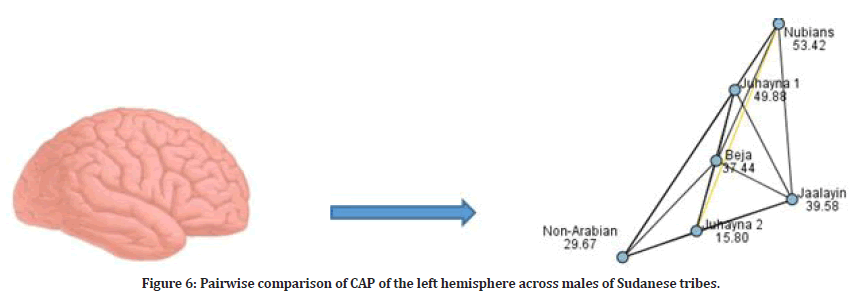
Figure 6:Pairwise comparison of CAP of the left hemisphere across males of Sudanese tribes.

Figure 7:Pairwise comparison of CAP of the total hemisphere across males of Sudanese tribes.
CAP of the right frontal lobe was larger in males of Juhyna “1” than in Non-Arabian tribes (P<0.05) (Figure 8). CAP of the left and total frontal lobes were smaller in Juhyna “2” than in Juhyna “1” and Nubians tribes (P<0.05) (Figures 9 and Figure 10). However, CAP of the right, left, and total frontal lobes were not different from other Sudanese tribes (P>0.05).

Figure 8:Pairwise comparison of CAP of the right frontal lobe across males of Sudanese tribes.

Figure 9:Pairwise comparison of CAP of the left frontal lobe across males of Sudanese tribes.
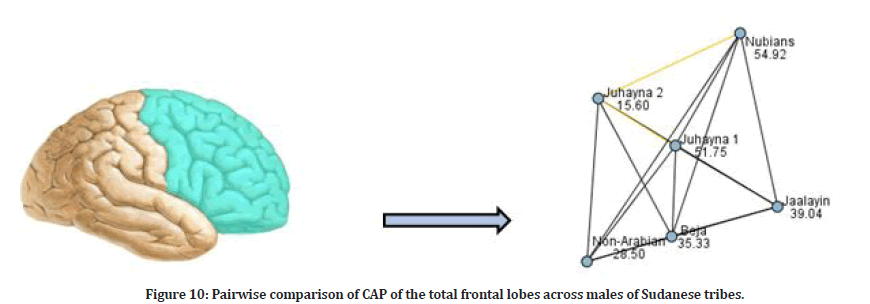
Figure 10:Pairwise comparison of CAP of the total frontal lobes across males of Sudanese tribes.
There were differences in cortical area pial (CAP) of cingulate, superior frontal gyrus, precentral gyri, pars orbitalis, and orbitofrontal gyri (P<0.05); however, there was no difference in CAP of other frontal lobe gyri across males of Sudanese tribes (P<0.05). CAP of the left and total superior frontal gyri was significantly greater in males of Nubians than Jaalayin, Juhyna “2”, Non-Arabian tribes; it was also significantly greater in males of Juhyna “2” than Juhyna “1” (Figures 11 and Figure 12). CAP of the total pars orbitalis was greater in males of Juhyna “1” than in the Jaalayin tribes (Figure 13). CAP of the left orbito-frontal gyri was greater in males of Juhyna “1” than Juhyna “2”; it also was greater in Nubians than Juhyna “2” and Non-Arabian tribes (Figure 14). CAP of the total cingulate gyrus was significantly greater in Juhyna “1” males than Non-Arabian tribes (Figure 15).

Figure 11:Pairwise comparison of CAP of the left superior frontal gyrus across males of Sudanese tribes.
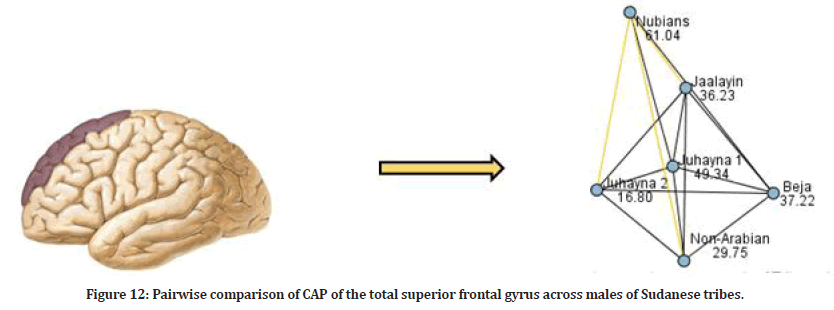
Figure 12:Pairwise comparison of CAP of the total superior frontal gyrus across males of Sudanese tribes.
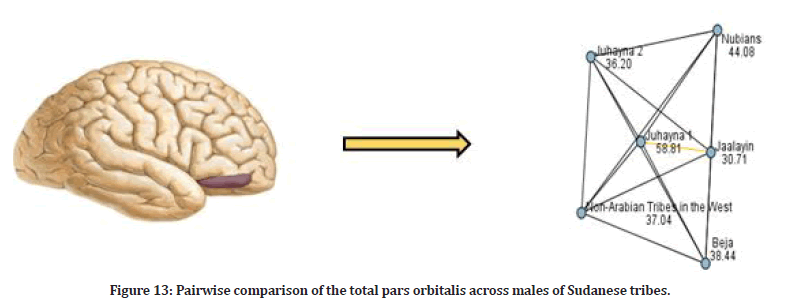
Figure 13:Pairwise comparison of the total pars orbitalis across males of Sudanese tribes.

Figure 14:Pairwise comparison of CAP of the left orbito-frontal gyri across males of Sudanese tribes.

Figure 15:Pairwise comparison of CAP of the total cingulate gyri across males of Sudanese tribes.
Across females of Sudanese tribes, there were no differences in cortical area pial of the hemispheres, frontal lobes, and frontal lobe gyri, with the exception of the middle frontal gyrus and pars orbitalis. CAP of the right middle frontal gyrus was smaller in females of Non- Arabian tribes than in Juhyna “2” tribes (Figure 16). CAP of the left pars orbitalis was greater in females of Juhyna “2” than in Beja tribes (Figure 17).
Surface Fraction of Cortical Area Pial (SF-CAP)
Across males of Sudanese tribes, there were no differences in SF-CAP of the hemispheres, frontal lobes, and frontal lobe gyri, with the exception of the precentral gyrus. SF-CAP of the right precentral gyrus was greater in males of Jaalayin than in Nubian tribes (Figure 18).
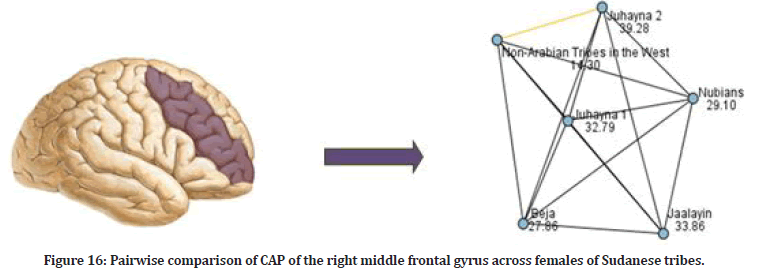
Figure 16:Pairwise comparison of CAP of the right middle frontal gyrus across females of Sudanese tribes.
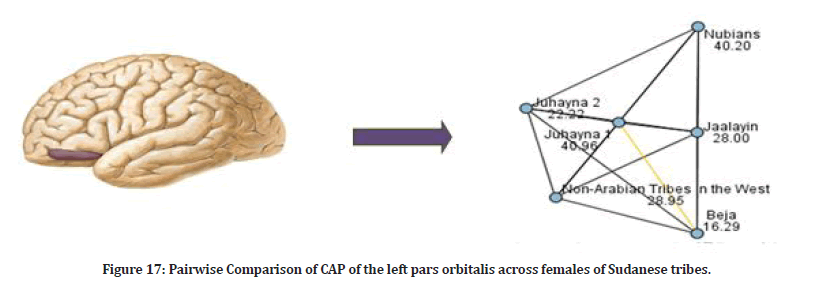
Figure 17:Pairwise Comparison of CAP of the left pars orbitalis across females of Sudanese tribes.

Figure 18:Pairwise Comparison of SF-CAP of the right precentral gyrus across females of Sudanese tribes.
Across females of Sudanese tribes, there were no differences in the mean surface fraction of cortical area pial of the hemispheres, frontal lobes, and frontal lobe gyri; with the exception of the right middle frontal gyrus and pars triangularis; which were smaller in females of Non-Arabian tribes than Juhyna “2” (Figures 19 and Figure 20).

Figure 19:Pairwise Comparison of SF-CAP of the right middle frontal gyrus across females of Sudanese tribes.

Figure 20:Pairwise Comparison of SF-CAP of the right pars triangularis across females of Sudanese tribes.
Discussion
The present study's results revealed no significant difference in cortical thickness of the cerebral hemispheres, frontal lobes, and frontal lobe gyri across males and females of Sudanese tribes. According to this finding, cortical thickness is an independent variable for the race.
Across Sudanese tribes, there were significant differences in cortical area pial of the cerebral hemisphere, frontal lobe, cingulate, precentral, superior frontal gyrus, pars orbitalis, and orbito-frontal gyri.
Across females of Sudanese tribes, there were no significant differences in cortical area pial of the cerebral hemispheres, frontal lobes, and frontal lobe gyri, with the exception of the middle frontal gyrus and pars orbitalis.
The present work demonstrated that genetic variability strongly influences regional cortical surface area. The cortical surface area is a highly heritable construct, yet, it has been largely overlooked in human imaging genetics research. Specific mutations in humans have been linked to excessive gyrification of the cortex as well as an increase in the cortical surface area [10].
Across males of Sudanese tribes, there were no significant differences in the mean surface fraction of cortical area pial of the cerebral hemispheres, frontal lobes, and frontal lobe gyri, with the exception of the precentral gyrus.
Across females of Sudanese tribes, there were no significant differences in the surface fraction of cortical area pial of the cerebral hemispheres, frontal lobes, and frontal lobe gyri, with the exception of the middle frontal gyrus and pars triangularis.
According to the radial unit hypothesis of cortical convolution, it has been suggested that an increase in the number of neurons results in surface expansion rather than in a thicker cortex [11].
Suppose a larger surface reflects more numerous neurons. In that case, such tissue enlargements might be advantageous by facilitating efficient processing of ongoing and outgoing information, which might benefit cognitive performance.
Conclusion
The race does not affect the cortical thickness of the hemispheres, frontal lobes, and frontal lobe gyri.
The surface fraction of cortical area pial of the frontal lobe and most of the frontal lobe gyri is not affected by race, with the exception of pars triangularis, precentral, and middle frontal gyri. Further studies should clarify the relationship between the surface fraction of pars triangularis, precentral, and middle frontal gyri and functions.
Cortical area pial is the most variable affected by race, and these differences are more reported in males than females of Sudanese tribes. The following cortical area pial are different between Sudanese tribes: hemisphere, frontal lobe, cingulate, superior frontal gyrus, precentral gyri, pars orbitalis, and orbitofrontal gyri were significantly different between Sudanese. Further research ought to answer the following questions: What is responsible for these race differences in cortical area pial, and are they genetically and/or environmentally caused?
Funding
This study has not received any external funding.
Conflict of Interests
The authors declare that there are no conflicts of interest.
Acknowledgement
This publication was supported by the Deanship of Scientific Research at Prince Sattam bin Abdulaziz University, Alkharj, Saudi Arabia.
References
- Snell RS. The structure and functional localization of the cerebral cortex, in clinical neuroanatomy. Lippincott Williams & Wilkins: Philadelphia 2010; 285-298.
- Standring S. Neuroanatomy, in Gray's Anatomy. Elsevier Inc: Spaine 2008; 397-390.
- Narr KL, Woods RP, Thompson PM, et al. Relationships between IQ and regional cortical gray matter thickness in healthy adults. Cereb Cortex 2007; 17:2163.
- Salat DH, Buckner RL, Snyder AZ, et al. Thinning of the cerebral cortex in aging. Cereb Cortex 2004; 14:721-730.
- Henery CC, Mayhew TM. The cerebrum and cerebellum of the fixed human brain: Efficient and unbiased estimates of volumes and cortical surface areas. J Anat 1989; 167:167.
- Goldstein JM, Seidman LJ, Horton NJ, et al. Normal sexual dimorphism of the adult human brain assessed by in vivo magnetic resonance imaging. Cereb Cortex 2001; 11:490-497.
- Lv B, Li J, He H, et al. Gender consistency and difference in healthy adults revealed by cortical thickness. Neuroimage 2010; 53:373-382.
- Shaw P, Kabani NJ, Lerch JP, et al. Neurodevelopmental trajectories of the human cerebral cortex. J Neurosci 2008 ;28:3586-3594.
- Wierenga LM, Langen M, Oranje B, et al. Unique developmental trajectories of cortical thickness and surface area. Neuroimage 2014; 87:120-126.
- Jansen A, Andermann E. Genetics of the polymicrogyria syndromes. J Med Gen 2005; 42:369-378.
- Rakic P. Specification of cerebral cortical areas. Science 1988; 241:170.
Indexed at, Google Scholar, Cross Ref
Indexed at, Google Scholar, Cross Ref
Indexed at, Google Scholar, Cross Ref
Indexed at, Google Scholar, Cross Ref
Indexed at, Google Scholar, Cross Ref
Indexed at, Google Scholar, Cross Ref
Indexed at, Google Scholar, Cross Ref
Author Info
Wegdan Ahmed1, Tahir Osman Ali2, Bunyamin Sahin3, Samy Ismail4, Mohammed H Karrar Alsharif5* and Amani Elfaki1
1Departments of Anatomy, Faculty of Medicine, National University, Khartoum, Sudan2Anatomy Department, Faculty of Medicine, National Ribat University, Sudan
3Department of Anatomy, Faculty of Medicine, Ondokuz Mayis University, Samsun, Turkey
4Department of Anatomy, Faculty of Medicine, Alzaiem Al-Azhari University, Sudan
5Department of Basic Medical Sciences, College of Medicine, Prince Sattam Bin Abdulaziz University, Al-Kharj, 11942, Saudi Arabia
Received: 23-Aug-2022, Manuscript No. jrmds-22-75682; , Pre QC No. jrmds-22-75682(PQ); Editor assigned: 25-Aug-2022, Pre QC No. jrmds-22-75682(PQ); Reviewed: 09-Sep-2022, QC No. jrmds-22-75682(Q); Revised: 13-Sep-2022, Manuscript No. jrmds-22-75682(R); Published: 20-Sep-2022
