Research - (2021) Volume 9, Issue 6
A Study on Platelet Indices in Controlled and Uncontrolled Hypertensive and Diabetic Subjects
K Uma Maheswari and MR Renuka Devi*
*Correspondence: MR Renuka Devi, Department of Physiology, Sree Balaji Medical College & Hospital Affiliated to Bharath Institute of Higher Education and Research, Chennai, Tamil Nadu, India, Email:
Abstract
Diabetes Mellitus (DM) commonly referred as a Diabetes; a clinical syndrome characterized by an increase in blood glucose concentration (hyperglycaemia). The symptom of hyperglycaemia includes polyuria, polydipsia, polyphagia, weight loss, tiredness, and blurred vision. Diabetes Mellitus associated with microvascular (retinopathy, nephropathy, and neuropathy, that can either be peripheral neuropathy (i.e., sensory loss, pain, motor weakness) or autonomic neuropathy) and macrovascular (coronary artery disease (CAD), peripheral arterial disease (PAD) and cerebrovascular disease (CVD)) complications. These complications are the major cause for increase rate of morbidity, mortality and decrease quality of life Platelet plays an essential function in normal haemostasis which serves to maintain the integrity of the vasculature upon injury. To study the platelet indices in controlled, uncontrolled Diabetic Mellitus and Hypertensive subjects and to compare it with normal subjects.
Keywords
Diabetes mellitus, Microvascular, Macrovascular, Platelet indices, Hypertensive
Introduction
Platelet plays an essential function in normal haemostasis which serves to maintain the integrity of the vasculature upon injury. The functions of platelets include the process of inflammation, innate immunity, angiogenesis, growth, and developments, wound healing and cancer metastasis [1-4]. The normal range of platelet count is 1,50,000 to 3,00,000 lakh / microliter [5]. Platelet Indices include the parameter such as mean platelet volume, platelet distribution width, platelets. The mean platelet volume is an index of the average size of platelet in blood. It can also use as a marker for size distribution of platelets and assessing the platelet function and activation [6]. MPV is associated to increase in platelet aggregation, increase in release of adhesion molecules, and increase risk of cardiovascular and peripheral arterial diseases [7]. An increased MPV indicates increased production of platelets resulting in higher tendency to clot. Low MPV indicate decreased production of platelet and associated with bleeding [8].
Platelet distribution width (PDW) reflect about how uniform the size of platelet. PDW is a simple, and specific marker of platelet activation. An increase in PDW is indicator for platelet anisocytosis. Platelet activation causes formation of pseudopodia resulting in increased PDW. Platelets (PCT) is measure of total platelet mass. PCT is related to the platelet count and size of the platelets. It is the most effective screening tool for detecting the quantitative abnormalities of platelet. Platelet size is considered as a marker and determinant of platelets function. Elevated platelet size (mean platelet volume) is more reactive and produces more prothrombotic factors. MPV is associated with an increase of platelet aggregation, increase in release of adhesion molecules, and increase risk of cardiovascular and peripheral arterial diseases [7].
Increase platelet size alters the morphology of platelet. Larger platelet is most reactive, easily aggregable. It contains a greater number of dense granules that release the adhesion molecules. MPV and PDW shows the reflection in the variation of size in the circulating platelets. PDW and PCT is also important in atherosclerosis and thrombosis [8-10]. Automated blood cell analysers in the laboratories were not only used to determine complete blood count and platelet count. The indices related to platelet count such as mean platelet volume, platelet distribution width and platelets are also estimated. Diabetes Mellitus (DM) commonly referred as a Diabetes; a clinical syndrome characterised by an increase in blood glucose concentration (hyperglycaemia). The symptom of hyperglycaemia includes polyuria, polydipsia, polyphagia, weight loss, tiredness, and blurred vision. Diabetes Mellitus associated with microvascular (retinopathy, nephropathy, and neuropathy, that can either be peripheral neuropathy (i.e., sensory loss, pain, motor weakness) or autonomic neuropathy) and macrovascular (coronary artery disease (CAD), peripheral arterial disease (PAD) and cerebrovascular disease (CVD)) complications. These complications are the major cause for increase rate of morbidity, mortality and decrease quality of life [11].
Materials and Methods
Totally 300 subjects (100 Diabetes Mellitus,100 Hypertension and 100 control group) attending the Endocrinology and General Medicine Department in Sree Balaji Medical College &Hospital, Chromepet. Subjects with different age groups of both genders were recruited for this study.
Documentation of diabetes mellitus
After an overnight fasting, around 5 ml venous blood were collected from all the subjects to estimate the Fasting Blood Sugar, Post-Prandial Blood Sugar, and glycosylated Haemoglobin (HbA1c). Fasting Blood Sugar and Post-Prandial Blood Sugar analysed by the GOD-POD (Glucose Oxidase - Peroxidase) method and glycosylated Hemoglobin (HbA1c) is assessed by turbitometric method–direct method.
Inclusion criteria
Age group-25 to 70 years.
Both male and female gender.
All known cases and newly diagnosed Type 1 and 2 Diabetes Mellitus and Hypertension (Patients having blood pressure ≥ 140/90 mmHg) were selected. The subject on oral hypoglycaemic drugs and antihypertensive treatment were included. Healthy volunteers with no medical illness (control group).
Exclusion criteria
Subjects suffering from following history or disease are excluded from the study.
Collection of sample
The subjects were instructed to provide their blood sample after an overnight fasting for about 10 to 12 hours. 7ml of blood is collected in the plain, EDTA tubes by venepuncture of median cubital vein using a sterile disposable syringe after following the precaution measures. The collected blood samples were labelled with subjects age, sex, and identification number. According to manufacturer instructions, standardisation, calibration of the instruments the processing of samples was done.
Methods of sample collection
Fasting Blood Sugar and Post-Prandial Blood Sugar analysed by the GOD-POD (Glucose Oxidase–Peroxidase) method and Glycosylated Haemoglobin (HbA1c) are assessed by turbidimetric method–direct method. The platelet count is determined through both impedance technology and an optical method.
Mean Platelet Volume was calculated by following formula:
MPV (fL)=[(Platelets (%) / Platelet count (x109/l)].
Platelets (PCT) is the ratio of platelet volume in relation to blood volume.
Platelet Distribution Width (PDW) is the uniform the size of the platelet.
Statistical analysis
Data collected was entered in Microsoft Excel sheet. Means, Standard Deviation were used to describe the sample.
Data were expressed as mean ± SD (standard deviation) and analysed by using independent samples test in SPSS (Statistical Package for Social Sciences) version 20 and subjected to appropriate statistical analysis.
Results
A total of 300 subjects (100 subjects with Diabetes Mellitus (DM), 100 with Hypertension and 100 healthy controls) enrolled for this study.
In normal (non-Diabetic) group, 50 were males and 50 were females. Mean age was 42.8 ± 8.67 years and the mean BMI was 22.69 ± 1.45 in normal group. There were 62 males and 38 female Diabetic subjects in the study.
The Diabetic group was divided into controlled and uncontrolled DM. In controlled group of 50 Diabetic patients, 32 subjects were males, and 18 subjects were females. In Uncontrolled group of 50 Diabetic patients, 30 subjects were males, and 20 subjects were females.
Table 1 shows the mean and standard deviation values of Age, BMI and duration in controlled, uncontrolled DM subjects and independent sample t-test values and its significance.
Table 1: Comparison of physical characteristics between controlled and uncontrolled diabetes mellitus group.
| Characteristics | Diabetes mellitus group | T-test | P-Value | |
|---|---|---|---|---|
| Controlled dm (n=50) Mean ± SD | Uncontrolled dm (n=50) Mean ± SD | |||
| Age (years) | 55.42 ± 7.25 | 54.5 ± 10.98 | 0.494 | 0.622 |
| BMI(kg/m2) | 28.08 ± 3.61 | 27.09 ± 3.99 | 1.301 | 0.196 |
| Duration (years) | 5.70 ± 2.17 | 6.78 ± 2.49 | 2.31 | 0.02 |
In controlled Diabetic group, the mean age was 55.42 ± 7.25 years, mean BMI was 28.08 ± 3.61 and mean duration of Diabetes was 5.70 ± 2.17 years.
In Uncontrolled Diabetic group, the mean age was 54.5 ± 10.98 years, mean BMI was 27.09 ± 3.99 and mean duration of the Diabetes was 6.78 ± 2.49 years. Table 1 shows that the subjects in the sample are matched and p value shows no significance.
Table 2 shows the mean and standard deviation of blood parameters like FBS, PPBS, HbA1c and platelet count in controlled and uncontrolled DM patients. In controlled DM, the mean fasting blood sugar level is 105.8 ± 10.44 mg/dL while that of the uncontrolled DM group is 185.2 ± 76.92mg/dL. The mean post – prandial blood sugar level was 133.8 ± 15.01mg/dL in controlled DM, whereas in uncontrolled DM, it is 288.9 ± 108.5mg/dL. The mean HbA1c level in controlled DM group is 6.03 ± 0.43 % as compared to 8.85 ± 1.42 % of the uncontrolled DM group. Among the Diabetic group, the FBS, PPBS and HbA1c was higher in uncontrolled DM than the controlled DM subjects, which is statistically significant. The mean platelet count in the controlled DM group was 2.69 ± 0.60 lakh/cu.mmas compared to 2.97 ± 0.81 lakh/cu. Mm of uncontrolled DM group. The analysis shows that there was no significance between the platelet count of the two diabetic groups.
Table 2: Comparison of blood parameters between controlled and uncontrolled diabetes mellitus group.
| Diabetes mellitus group | T-Test | P-Value | ||
|---|---|---|---|---|
| Blood Parameters | Controlled DM (N=50) | Uncontrolled DM (N=50) | ||
| Mean ± SD | Mean ± SD | |||
| FBS (mg/dl) | 105.8 ± 10.44 | 185.2 ± 76.92 | 7.221 | <0.0001* |
| PPBS (mg/dl) | 133.8 ± 15.01 | 288.9 ± 108.5 | 10.005 | <0.0001* |
| HbA1c (%) | 6.03 ± 0.43 | 8.85 ± 1.42 | 12.89 | <0.0001* |
| PLTCT (lakh/cu.mm) | 2.69 ± 0.60 | 2.97 ± 0.81 | 1.92 | 0.058 |
*Statistically significant
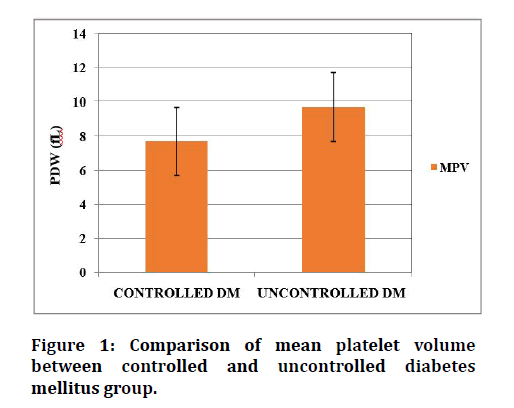
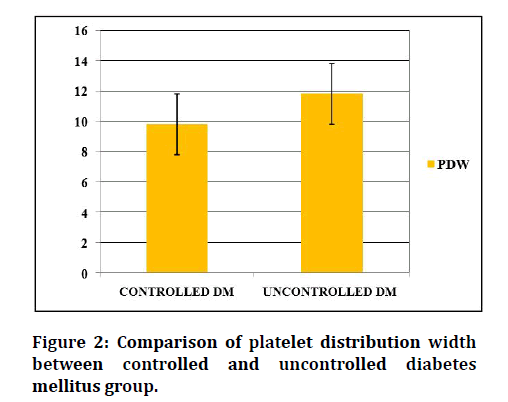
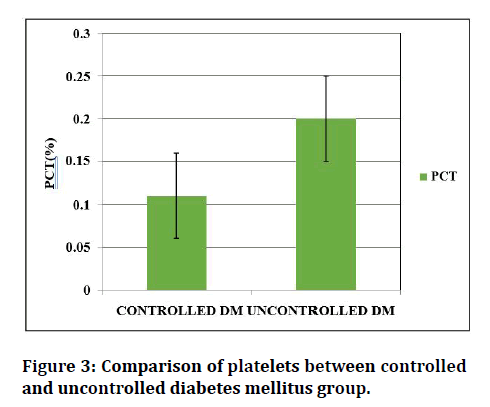
Table 3 and Figures 1 to 3 shows the mean and standard deviation of the platelet indices values (MPV, PDW, PCT) of two Diabetic groups. Mean platelet volume was higher in uncontrolled Diabetic subjects (9.7 ± 1.08 FL) than in the controlled DM (7.7 ± 0.90 FL) subjects. PDW was higher in uncontrolled DM group (11.75 ± 1.67 FL) than in the controlled DM group (10.05 ± 0.81fL). PCT was found to be high in the uncontrolled DM group (0.20 ± 0.05%) than in the controlled DM group (0.11 ± 0.005%). Platelet indices between controlled and uncontrolled DM was statistically significant.
Figure 1: Comparison of mean platelet volume between controlled and uncontrolled diabetes mellitus group.
Figure 2: Comparison of platelet distribution width between controlled and uncontrolled diabetes mellitus group.
Figure 3: Comparison of platelets between controlled and uncontrolled diabetes mellitus group.
Table 3: Platelet indices in diabetic mellitus subjects.
| Platelet indices | Diabetes mellitus group n=100 | T-test | P-value | |
|---|---|---|---|---|
| Controlled DM (n=50) | Uncontrolled DM (n=50) | |||
| mean ± SD | mean ± SD | |||
| MPV (fL) | 7.7 ± 0.90 | 9.7 ± 1.08 | 10.31 | <0.0001* |
| PDW (fL) | 9.8 ± 0.82 | 11.8 ± 1.67 | 7.061 | <0.0001* |
| PCT (%) | 0.11 ± 0.005 | 0.20 ± 0.05 | 12.52 | <0.0001* |
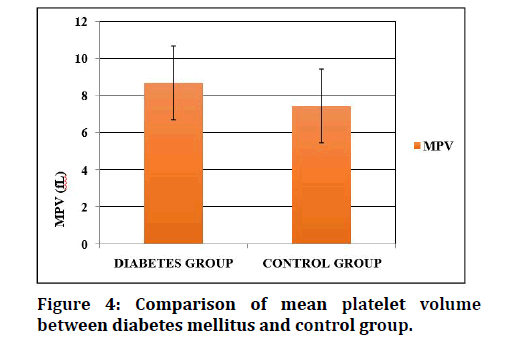
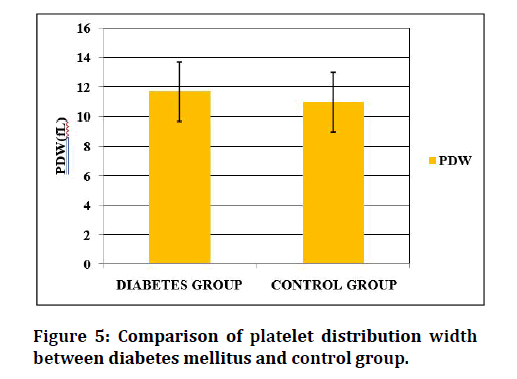
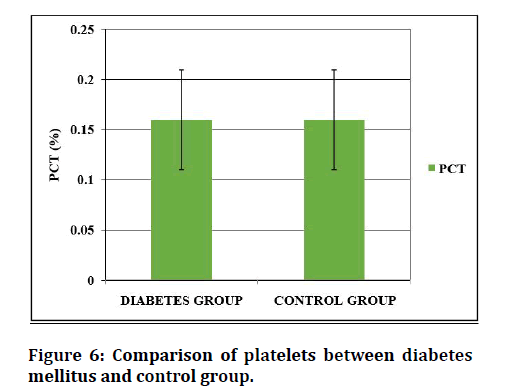
Table 4 and Figures 4 to 6 shows the comparison of the platelet indices between the Diabetic group and control group. The mean platelet volume of Diabetes is 8.69 ± 1.43fL, as compared to 7.44 ± 0.68fL of the control group. The mean value of PDW in Diabetes Mellitus is 11.7 ± 1.28fL and 10.92 ± 1.17fL in non–Diabetic subjects. MPV and PDW shows statistical significance. The platelets were not significant between Diabetic and control group. Among the 100 Hypertension patients, there were 45 males and 55 female Hypertension subjects in the study. The hypertension group was divided into controlled HTN and uncontrolled HTN. In controlled group of 50 hypertensive patients, 24 subjects were males, and 26 subjects were females. Whereas in uncontrolled group, 21 subjects were males, and 29 subjects were females.
Figure 4: Comparison of mean platelet volume between diabetes mellitus and control group.
Figure 5: Comparison of platelet distribution width between diabetes mellitus and control group.
Figure 6: Comparison of platelets between diabetes mellitus and control group.
Table 4: Platete indices between diabetic and control subjects.
| Diabetes mellitus group (N=100) | Control group (N=100) | T-test | P-value | |
|---|---|---|---|---|
| Platelet indices | Mean ± SD | Mean ± SD | ||
| MPV (fL) | 8.69 ± 1.43 | 7.44 ± 0.68 | -7.89 | <0.0001* |
| PDW (fL) | 11.7 ± 1.28 | 10.92 ± 1.17 | -4.468 | <0.0001* |
| PCT (%) | 0.16 ± 0.05 | 0.16 ± 0.03 | 0 | 1 |
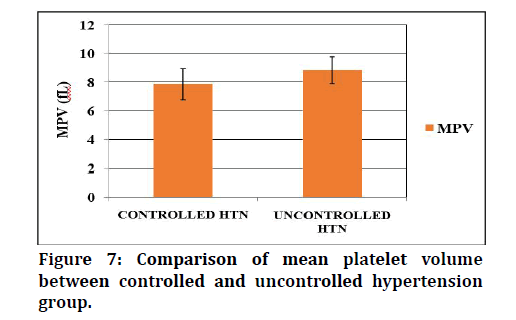
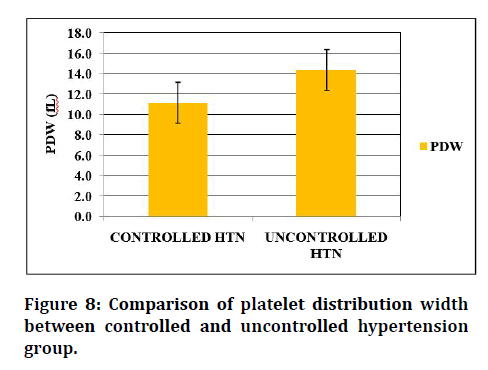
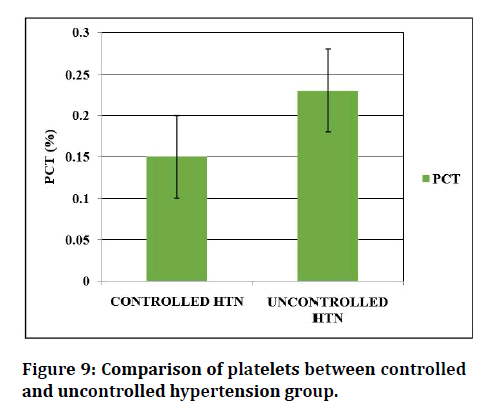
Figure 7-9 shows the mean and standard deviation of platelet indices (MPV, PDW, PCT) values in the twohypertensive group. Mean platelet volume was higher in uncontrolled subjects 8.82 ± 0.94fL than in the controlled DM 7.84 ± 1.10fL subjects. PDW was higher in uncontrolled HTN group (14.35 ± 1.66fL) than in the controlled Hypertension group (11.75 ± 1.67 FL) .PCT was found to be high in the uncontrolled Hypertension group (0.23 ± 0.057%) than in the controlled Hypertension group (0.15 ± 0.02%). The platelet indices of the Hypertension subjects between controlled and uncontrolled was statistically significant.
Figure 7: Comparison of mean platelet volume between controlled and uncontrolled hypertension group.
Figure 8: Comparison of platelet distribution width between controlled and uncontrolled hypertension group.
Figure 9: Comparison of platelets between controlled and uncontrolled hypertension group.
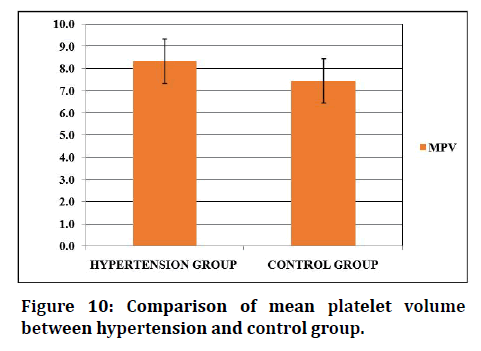
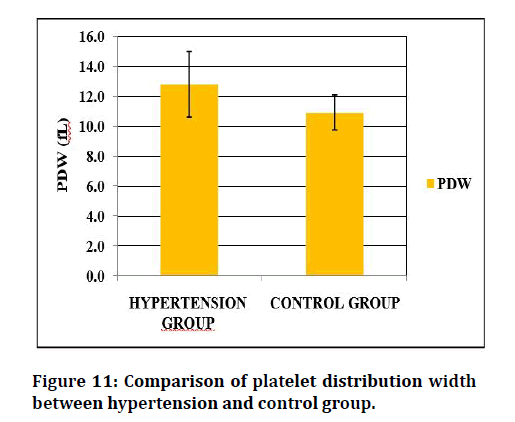
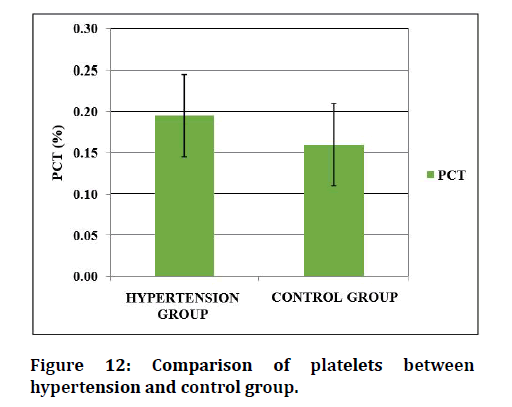
Figure 10 to Figure 12 shows the comparison of the platelet indices between the hypertensive group and control group. The mean platelet volume of hypertensive subjects is 8.33 ± 1.13fL, as compared to 7.44 ± 0.68 FL of controls. The mean value of PDW in hypertensives are 12.8 ± 2.197 FL and 10.92 ± 1.17fL in controls. MPV and PDW shows statistical significance. The platelets of hypertensive subject is 0.195 ± 0.063% and 0.16 ± 0.03% was significant in both HTN and controls.
Figure 10: Comparison of mean platelet volume between hypertension and control group.
Figure 11: Comparison of platelet distribution width between hypertension and control group.
Figure 12: Comparison of platelets between hypertension and control group.
Discussion
Platelet dysfunction in diabetes mellitus
Platelet plays a important role in maintaining the normal haemostasis. Changes in platelet morphology and its functions have been reported in Diabetes Mellitus. Platelets of Diabetes Mellitus is associated with pathological process and has an increased risk of developing the vascular complications. In our study, the age of Diabetes Mellitus was ranged from 29-68 years. The mean age was 59.96 ± 9.27 years. Table 1 shows, there is no statistical significance between mean age of controlled Diabetes Mellitus with the uncontrolled Diabetes Mellitus. This means our findings were not influenced by age. Like our study, there were no significant difference of age and sex of the Diabetic and non-Diabetic subjects. The Body mass index is higher in Diabetic group than the non - Diabetic group. This result is like Biswal et al study. Therefore, in our study, the sample chosen were matched with respect to the anthropometric data between the two Diabetic groups.
In our study, the mean FBS, PPBS and HbA1c of uncontrolled Diabetes was higher when compared to the controlled Diabetes group. There is a statistically significant between the two Diabetic groups. Like the previous studies the mean value of HbA1c in my study is 7.47 ± 1.74%. The glycaemic status of uncontrolled Diabetes was higher (8.85 ± 1.42%) when compared to the controlled Diabetes group. When compared to the normal subjects, the Diabetes Mellitus subject is significantly higher. Similar findings were found in other studies.
The platelet count in controlled DM group (2.69 ± 0.60lakh/cu.mm) was lower that of uncontrolled DM group (2.97 ± 0.81lakh/cu.mm) but was not statistically significant (p=0.058). When compared to the controls (2.49 ± 0.74lakh/cu.mm), the platelet count was higher in Diabetes, but it is not statistically significant (p=0.0012). This result was compatible to the results of previous studies. Platelet count was found to be lower in the Diabetic group; however, there difference was not significant in other studies. The decreased platelet count could be due to consumption of smaller platelets to maintain a constant platelet functional mass [12-31]
The average MPV value is 8.69 ± 1.43 fL in Diabetic group, and 7.44 ± 0.68 fL in non - Diabetic (normal) group. MPV is significantly high in my study. The results of our study were similar previous studies. MPV is an indicator of average platelet size and its function. Platelets become hyperreactive in Diabetes subjects that causes increase in activation, adhesion, and aggregation. Studies reported that larger platelets are younger, more active, and more adhesive than small ones. They contain dense granules that secretes the prothrombotic factors such as serotonin, β-thromboglobulin, platelet factor 4, and platelet-derived growth factor, that produces more thromboxane A2 and possess greater aggregability in response to ADP. Jones et al. [32] study reported that association of increased platelet volume and reduced platelet survival in Diabetic subjects. Therefore, larger platelets circulating in blood are mainly by increase in MPV, that predispose to thrombotic vascular complication in Diabetes patients.
In our study we compared the platelet indices parameters between 50 controlled Diabetic and 50 uncontrolled Diabetic patients. Table 3 shows that all platelet indices parameters were increased in uncontrolled Diabetic patients when compared to the controlled Diabetic patients. This finding was like previous studies. The platelet indices were statistically significant between the two Diabetic group. A high MPV is an important predictor for an increased risk for thrombosis and complications. Several mechanisms has been proposed for an increased platelet activity in Diabetes due to hyperglycaemia. The membrane proteins of platelet undergo a non–enzymatic glycation that reduces membrane fluidity and increase the platelet adhesion. An increase in calcium mobilisation from the storage pools and high level of intracellular calcium has been reported in Diabetes Mellitus patients. Intracellular free calcium is correlated. with the reduction membrane fluidity. Platelet activation was mediated by the protein kinase C activation. Furthermore, due to hyperglycemia, osmotic swelling occurs that increase the platelet reactivity by glucose metabolites.
Platelet distribution width level in our study was increased in Diabetes group when compared to non– Diabetic group. PDW is also significantly increased with poor glycaemic control. Our findings were reported as similar as previous study. Platelet activation causes changes in the morphology and pseudopodia formation. This difference in size and shape (discoid to spherical) leads to change in platelet distribution width. In our study, platelets (PCT) was found higher in the uncontrolled Diabetic group (0.20 ± 0.05%) that the controlled Diabetic group (0.11 ± 0.005%). There was a statistically significant (p<0.0001) in between two Diabetic group. Platelets is higher in Diabetic groups and the normal group. Since the larger platelets are more reactive in Diabetic subjects, the platelet mass increases, thereby PCT increases. Swaminathan et al study, found that PCT is high in the type 2 Diabetes Mellitus subjects. In khan et al study, PCT was higher in patients with hyperglycaemia than the normoglycemia.
Platelet and hypertension
Among the 100 Hypertension patients, there were 45 males and 55 female subjects in varies age group. The hypertension group was divided into controlled HTN and uncontrolled HTN. The mean age, BMI and the duration of hypertension was matched between the two hypertensive groups. In my study, the platelet indices (MPV, PCT and PDW) was significantly high in subjects with uncontrolled hypertension than in controlled hypertension. Mean platelet volume is increased in hypertensive group than that of the controls.
Normally, platelets are derived from megakaryocytes, the newly produced platelets are not large and dense. Increased platelet reactivity leads to shortening of bleeding time and increased platelet volume. The elevation in the blood pressure levels causes changes in the vascular endothelium and platelets. The platelet become larger, metabolically, and enzymatically more active and produces more thromboxaneA2 and B2, which increases the thrombotic activity. Even the uncontrolled blood pressure causes damage via the shear stress, that activates the platelet and thereby increases the MPV.
Like our study results, increase in MPV is seen in earlier studies. A previous study found that MPV was increased in essential hypertensive and white coat hypertensive subjects than in normotensive group. Another study says that MPV is high in non-dipping hypertensive individuals than in dipping hypertensive individuals. This increase in MPV level in HTN subjects might increase the inflammation, target organ damage and other complications. The platelet distribution width is higher in uncontrolled hypertensive group than the controlled hypertensive group. As the PDW can measure the variability in platelet size and reflect the heterogeneity in their morphology, the activated platelets cause changes in morphology as well the shape from discoid to spherical and pseudopodia formation. Increase in PDW was found in studies.
The platelets is also higher in uncontrolled hypertensive group than the controlled hypertensive group. The changes in the mean platelet volume, platelet distribution width will affect the platelets as it strongly predicts the amount of platelets circulating in one unit of blood volume. In hypertension the platelet indices parameters were found to be increased in uncontrolled HTN group compared with controlled HTN group. These findings suggest that platelet activities play an important role in hypertension [33-38].
Conclusion
Our study found that hyperglycaemia and hypertension lead to platelet hyperactivity. The uncontrolled Diabetes Mellitus have a poor glycaemic control, that leads to increase in morbidity and mortality. In hypertension, increase in platelet indices leads to increase in thrombotic potential, thereby increases the cardiovascular risk. Both the Diabetes Mellitus and hypertension should be maintained under control. The control of glycaemic status in each Diabetic individual can prevent the development of micro vascular and macro vascular complications. The regular treatment for both Diabetes and hypertension is needed. Therefore, it improves the platelet activity and their functions. So, the platelet indices (MPV, PDW and PCT) could be used as a prognostic marker to monitor the platelet activation and progression of the complications in Diabetes Mellitus and Hypertension.
Funding
No funding sources.
Ethical Approval
The study was approved by the Institutional Ethics Committee.
Conflict of Interest
The authors declare no conflict of interest.
Acknowledgements
The encouragement and support from Bharath University, Chennai is gratefully acknowledged. For provided the laboratory facilities to carry out the research work.
References
- Ribatti D, Crivellato E. Giulio Bizzozero and the discovery of platelets. Leuk Res 2007; 31:1339–41.
- Fritsma G. Platelet structure and function. American Society for Clinical Laboratory Science 2015; 28:125–31.
- Ghoshal K, Bhattacharyya M. Overview of platelet physiology: Its hemostatic and nonhemostatic role in disease pathogenesis. ScientificWorld J 2014; 2014:781857.
- Thon JN, Italiano JE. Platelets: Production, morphology and ultrastructure. Handb Exp Pharmacol 2012; :3–22.
- Guyton, Hall. Textbook of medical physiology 11th Edn. Philadelphia, PA : Saunders/Elsevier;c2006. Chapter 36, Hemostasis and Blood Coagulation 457.
- Vizioli L, Muscari S, Muscari A. The relationship of mean platelet volume with the risk and prognosis of cardiovascular diseases. Int J Clin Pract 2009; 63:1509–1515.
- Machlus KR, Italiano JE. The incredible journey: From megakaryocyte development to platelet formation. J Cell Biol 2013; 201:785–96.
- DP Lokwani. The ABC of CBC: Interpretation of complete blood count and histogram. 1st Edn. New Delhi. Jaypee Brothers Medical Publishers 2013; 59-69.
- Wiwanitkit V. Plateletcrit, mean platelet volume, platelet distribution width: Its expected values and correlation with parallel red blood cell parameters. Clin Appl Thromb Hemost 2004; 10:175-178.
- Yilmaz T, Yilmaz A. Relationship between altered platelet morphological parameters and retinopathy in patients with type 2 diabetes mellitus. J Ophthalmol 2016; 2016:1 –5.
- Beckman JA, Creager MA, Libby P. Diabetes and atherosclerosis: Epidemiology, pathophysiology, and management. JAMA 2002; 287:2570–2581.
- IDF. Diabetes Atlas. 6th Ed. International Diabetes Federation, Brussels, Belgium; 2013.
- Shaw JE, Sicree RA, Zimmet PZ. Global estimates of the prevalence of diabetes for 2010 and 2030. Diabetes Res Clin Pract 2010; 87:4 –14.
- Sicree R, Shaw J, Zimmet P. Diabetes and impaired glucose tolerance. In: Gan D, editor. Diabetes atlas. International diabetes federation. 3rd ed. Belgium: International Diabetes Federation 2006; 103.
- Cola C, Brugaletta S, Yuste VM, et al. Diabetes mellitus: A prothrombotic state Implications for outcomes after coronary revascularization. Vasc Health Risk Manag 2009; 5:101–19.
- Saboor M, Ilyas MS. Platelets structural, functional and metabolic alterations in diabetes mellitus. Pak J Physiol 2012; 8:40-43.
- Watala C, Boncler M, Pietrucha T, et al. Possible mechanisms of the altered platelet volume distribution in type 2 diabetes: Does increased platelet activation contribute to platelet size heterogeneity? Platelets 1999; 10:52–60.
- Tschoepe D. The activated megakaryocyte-platelet-system in vascular disease: Focus on diabetes. Semin Thromb Hemost 1995; 21:152–160.
- Leoncini G, Signorello MG, Piana A, et al. Hyperactivity and increased hydrogen peroxide formation in platelets of NIDDM patients. Thromb Res 1997; 86:153–160.
- Small M, Douglas JT, Lowe GD, et al. Effect of insulin therapy on coagulation and platelet function in type II (non-insulin- dependent) diabetes mellitus. Haemostasis 1986; 16:417–23.
- Kearney PM, Whelton M, Reynolds K, et al. Global burden of hypertension: analysis of worldwide data. Lancet 2005; 365:217–23.
- Mohan V, Seedat Y, Pradeepa RG. The rising burden of diabetes and hypertension in Southeast Asian and African Regions: Need for effective strategies for prevention and control in primary health care settings. Int J Hypertension 2013; 2013:409083.
- Bloch MJ. Worldwide prevalence of hypertension exceeds 1.3 billion. J Am Society Hypertension 2016; 10:753–4.
- Alwan A. Global status report on noncommunicable diseases 2010. Geneva, Switzerland: World Health Organization 2011.
- Abebe SM, Berhane Y, Worku A, et al. Prevalence and associated factors of hypertension: A crossectional community based study in Northwest Ethiopia. PLOS ONE 2015; 10:e0125210.
- Kumar J. Epidemiology of hypertension. Clinical Queries: Nephrol 2013; 2:56–61.
- Gupta R, Khedar RS, Panwar RB. Strategies for better hypertension control in India and other lower middle income countries. J Assoc Physicians India 2016; 64:58–64.
- Anchala R, Kannuri NK, Pant H, et al. Hypertension in India: A systematic review and meta-analysis of prevalence, awareness, and control of hypertension. J Hypertens 2014; 32:1170 –7.
- Haresh C, Jyotsna P, Jivarajani P, et al. Prevalence and correlates of hypertension among adults in the urban area of Jamnagar, Gujarat, India. Electronic Physician 2010; 2.
- Lip GY. Target organ damage and the prothrombotic state in hypertension. Hypertension 2000; 36:975–7.
- Gasparyan AY, Ayvazyan L, Mikhailidis DP, et al. Mean platelet volume: A link between thrombosis and inflammation? Curr Pharm Des 2011; 17:47–58.
- Jones RL, Paradise C, Peterson CM. Platelet survival in patients with diabetes mellitus. Diabetes 1981; 30:486–9.
- Schneider DJ. Factors contributing to increased platelet reactivity in people with diabetes. Diabetes Care 2009; 32:525–7.
- Dalamaga M, Karmaniolas K, Lekka A, et al. Platelet markers correlate with glycemic indices in diabetic, but not diabetic-myelodysplastic patients with normal platelet count. Dis Markers 2010; 29:55–61.
- Khan SH, Ahmad SA. Platelet indices among subjects with and without diabetes mellitus and hypertension: A cross- sectional analysis at karachi, pakistan. J Postgraduate Med Institute 2015; 29.
- Yarlioglues M, Kaya MG, Ardic I, et al. Relationship between mean platelet volume levels and subclinical target organ damage in newly diagnosed hypertensive patients. Blood Press 2011; 20:92–97.
- Tsiara S, Elisaf M, Jagroop IA, et al. Platelets as predictors of vascular risk: Is there a practical index of platelet activity? Clin Appl Thromb Hemost 2003; 9:177–190.
- Enawgaw B, Adane N, Terefe B, et al. A comparative cross-sectional study of some hematological parameters of hypertensive and normotensive individuals at the university of Gondar hospital, Northwest Ethiopia. BMC Hematol 2017; 17:21.
Author Info
K Uma Maheswari and MR Renuka Devi*
Department of Physiology, Sree Balaji Medical College & Hospital Affiliated to Bharath Institute of Higher Education and Research, Chennai, Tamil Nadu, IndiaCitation: K Uma Maheswari, MR Renuka Devi, A Study on Platelet Indices in Controlled and Uncontrolled Hypertensive and Diabetic Subjects, J Res Med Dent Sci, 2021, 9(6): 159-167
Received: 25-Mar-2021 Accepted: 15-Jun-2021 Published: 22-Jun-2021

