Research - (2020) Advances in Dental Surgery
Assessment of the Feelings and Attitude of the Children Towards the Dentist
Keerthana R and Ganesh Jeevanadan*
*Correspondence: Ganesh Jeevanadan, Department of Pediatric Dentistry, Saveetha Dental College and Hospitals, Saveetha Institute of Medical and Technical Sciences, Saveetha University, Chennai, India, Email:
Abstract
Dental anxiety and fear of dental treatment in children are recognized in many countries as a public health dilemma. The aim of the study was to assess the feelings and attitudes of children toward their dentists. Data were obtained from a sample of children using a questionnaire. The study group comprised children aged 6–12 years attending the Department of Pedodontics in a private dental college. The questionnaire was administered to 200 children, comprising 98 girls and 102 boys. The questionnaire was designed to assess children’s perceptions of their dentists. The subjects were asked if they had visited the dentist before and if there were any physicians in the family. They were also asked to describe the attitudes of siblings regarding dental visits. In addition, each child was asked to choose pictures that indicated their preference regarding dentist gender, attire, and protective equipment, and the design of the dental clinic. The questionnaire data were coded and entered into IBM SPSS for statistical analysis. Descriptive and analytic approaches were used in the data analysis. The chi-square test determines the relationship among variables. In our study we found out that most of the patients did not have a previous dental experience (49%) and among the 49% patients, most of them liked their experience. (55.1%) with majority being female patients (30.6%) and there was no statistical significance (=0.440). It was also found that most of the patients did not have a physician in the family. (83.5%) Most of the patients’ siblings liked their previous dental experience. (55%) Male dentists (72%) were the most preferred one regardless of the patient's gender and the results were statistically significant.(p=0.000) White coats were preferred by male patients (43%) and colour coats were preferred by the female patients (25.5%) and the results were statistically significant. (p=0.000) Dentists wearing elightful masks were the most common preference of the patients. (67%) Within the limits of the study, it was found that most of the patients liked their first visit to the dentist in which most were female patients and there was no statistically significant association. Most of the patients preferred to be treated by a male dentist, regardless of the child’s gender and a statistically significant association was seen. Most of the male patients preferred white coats and most of the female patients preferred colour coats and a statistically significant association was seen.
Keywords
Attitude, Delightful masks, White coat
Introduction
In dental practice, most children do not cooperate during dental procedures and sometimes it is exceedingly difficult to manage a child in a dental clinic. These management difficulties are related not only to the technical procedures involved, but also to the different emotional upsets experienced by children. The most common emotional upsets seen during dental treatment are anxiety and fear, which might originate from a previous traumatic experience in the dental office or during hospitalization for other reasons [1]. The terms dental fear and dental anxiety are often used synonymously and are considered to be the main reason for behavior management problems and avoidance of dental care. These problems sometimes require replacement of conventional treatment with more complicated alternatives, such as sedation or general anesthesia [2].
For some adults and children, a visit to the dentist is not an extraordinary event. For others it can be a terrifying experience that they will only put themselves through when the agony associated with a dental problem becomes unbearable. Fear of dentists and dental treatment has been considered a major hindrance to the delivery of quality dental services[3]. It is important for dentists to establish a friendly relationship with patients, especially children, to combat patient fears and to deliver effective and efficient treatment. Creating a strong rapport on the child’s first visit helps to create a comfortable atmosphere in which the child does not feel threatened. Children often make judgments about their dentist based on his or her appearance and often record and analyze their dentist’s every word, movement, and gesture during a dental appointment [4]. There continues to be debate regarding dental attire, whether it be clinical gown, shirt and tie or informal wear. Psychologists/sociologists highlight the importance of appearance and its effect upon first impressions and interpersonal relationships [5]. Initially, patients develop an impression of a clinician prior to verbal communication, including clothing, grooming and cleanliness. How a clinician dresses may be important in determining the success of the patient-clinician relationship [6]. Health professionals’ attire has changed over the years although the white coat has been an accepted symbol of medical staff for more than 100 years, originally to give ‘a cloak of scientific validity for their treatments, to represent purity and cleanliness [7]. However, fashion recently has played an influential role, giving rise to a medical workforce with a less formal look [8]. Surveys indicate that 5-6% of the population and 16% of school-age children fear dentists [9]. Indeed, children with active caries are more afraid than other children due to negative treatment experiences. Alvesalo et al. reported that boys with a DMFT score ≥1 had a significantly higher mean dental fear than those who were caries-free [10].
Our department is passionate about childcare, we have published numerous high-quality articles in this domain over the past 3 years [11–29]. With this inspiration we planned to pursue research on assessment of the feelings and attitude of the children towards the dentist.
Data were obtained from a sample of children using a questionnaire. The study protocol received institutional approval from the Ethics Committee of the university. The study group comprised children aged 6– 12 years attending the Department of Pedodontics in a private dental college. The questionnaire was administered to 200 children, comprising 98 (49%) girls and 102 (51%) boys. Consent was obtained from parents/guardians to participate in the study. 200 children were requested to participate in the study to obtain 200 completed questionnaires.
The questionnaire included seven items designed to assess children’s perceptions of their dentists. The subjects were asked if they had visited the dentist before and if there were any physicians in the family. They were also asked to describe the attitudes of siblings regarding dental visits. In addition, each child was asked to choose pictures that indicated their preference regarding dentist gender, attire, and protective equipment, and the design of the dental clinic.
Statistical Analysis. The questionnaire data were coded and entered into IBM SPSS for statistical analysis. Descriptive and analytic approaches were used in the data analysis. The chi-square test determines the relationship among variables.
Questionnaire
Have you been to a dentist before?
a) Yes b) No
How did you feel during dental treatment?
a) Liked it b) Do not like it
Is there a physician in your family?
a) Yes b) No
How did your sibling feel when he/she visited a dentist?
a) Liked it b) Did not like it
Do you prefer to be treated by a male or female dentist?
a) Male b) Female
Which outfit do you prefer?
a) Colored coat b) White coat
Which dentist do you prefer?
a) No dental protection b) Protective glasses
c) Mask d) Mask and protective e)Glasses
Results and Discussion
Mean age group of the participants in the study was 8.9 years. Frequency distribution of patients was done by gender where the most common gender was male (50.5%) followed by females (49.5%) (Figure 1). Frequency distribution of patients was done by age groups where the most age group were 7 years (20.5%) followed by 8 years (20%) followed by 9 years (16.5%) followed by 11 years (12.5%) followed by 10 years (12%) and 12 years (12%) followed by 6 years (6.5%) (Figure 2).
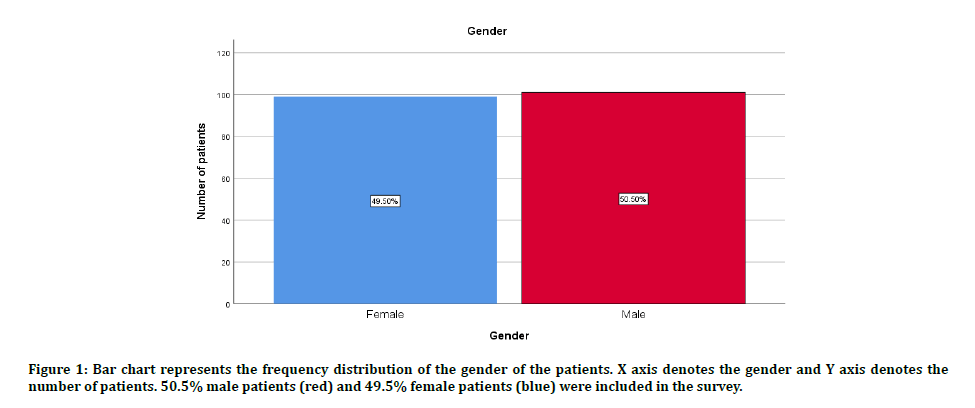
Figure 1: Bar chart represents the frequency distribution of the gender of the patients. X axis denotes the gender and Y axis denotes the number of patients. 50.5% male patients (red) and 49.5% female patients (blue) were included in the survey.
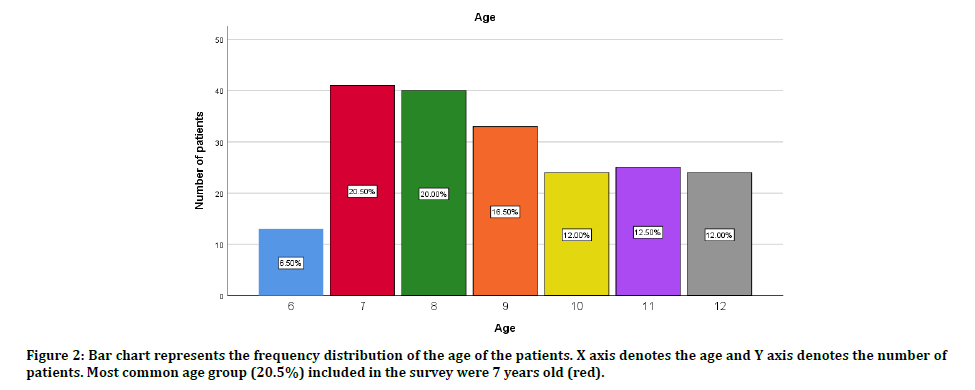
Figure 2: Bar chart represents the frequency distribution of the age of the patients. X axis denotes the age and Y axis denotes the number of patients. Most common age group (20.5%) included in the survey were 7 years old (red).
In this study, it was found that among the 200 patients 49% (98) of the patients have visited a dentist before and 51% (102) of the patients did not (Figure 3). Among the 98 patients who had visited the dentist before, 55.1% of the patients liked their previous experience with the dentist and 44.9% did not like the experience (Figure 4). Out of the 200 patients undertaken in the study, 16.5% of the patients had a physician in their family and 83.5% did not have one (Figure 5). 55% of the patients’ siblings liked the experience of the previous dental treatment and 45% did not (Figure 6). Male dentists (72%) were the most preferred dentist by the patients followed by the female dentists (28%) (Figure 7). Most preferred outfit by the patients was white coat (67%) compared to colour coat (33%) (Figure 8). The patients mostly preferred dentist with delightful masks (80%) followed by dentist with mo dental protection (11%) followed by dentist with both mask and protective glasses (8%) and followed by protective glasses (1%) (Figure 9).
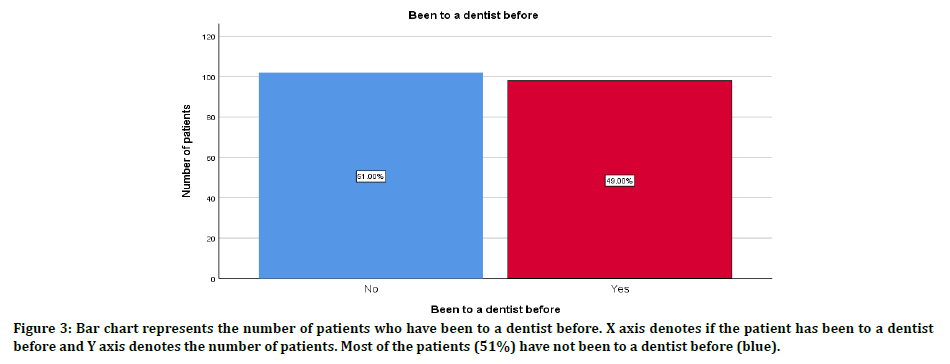
Figure 3: Bar chart represents the number of patients who have been to a dentist before. X axis denotes if the patient has been to a dentist before and Y axis denotes the number of patients. Most of the patients (51%) have not been to a dentist before (blue).
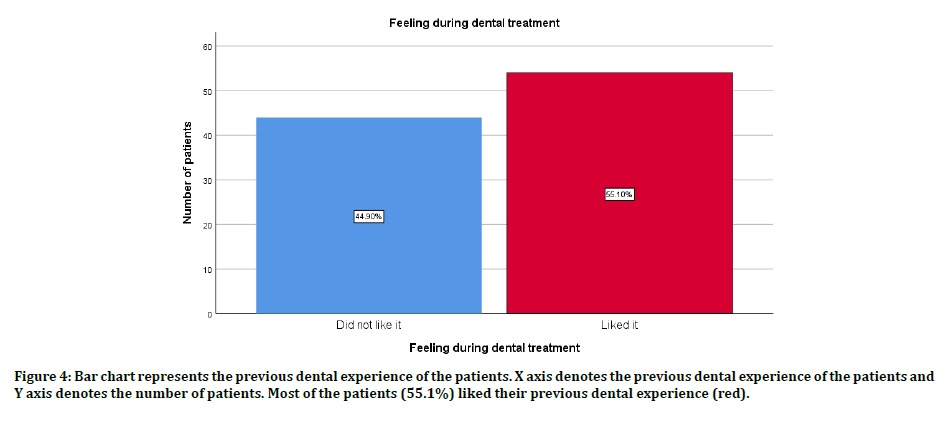
Figure 4: Bar chart represents the previous dental experience of the patients. X axis denotes the previous dental experience of the patients and Y axis denotes the number of patients. Most of the patients (55.1%) liked their previous dental experience (red).
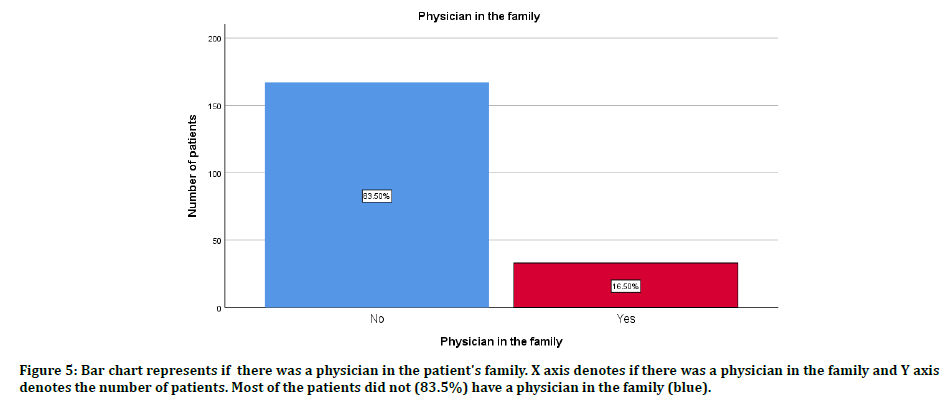
Figure 5: Bar chart represents if there was a physician in the patient's family. X axis denotes if there was a physician in the family and Y axis denotes the number of patients. Most of the patients did not (83.5%) have a physician in the family (blue).
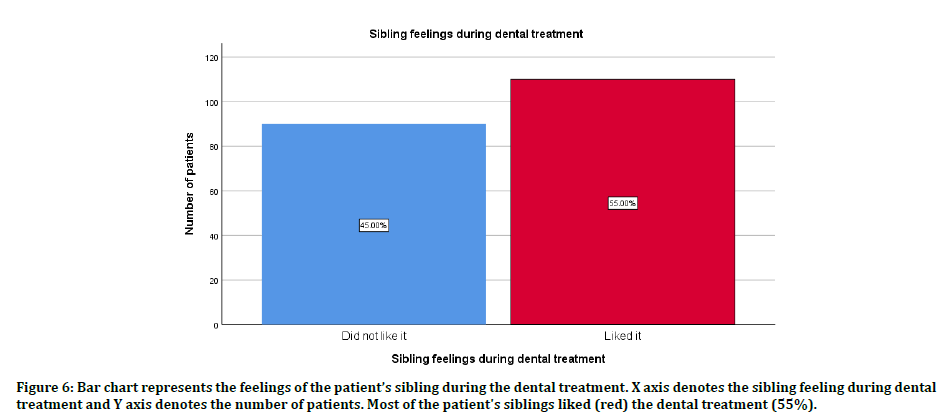
Figure 6: Bar chart represents the feelings of the patient’s sibling during the dental treatment. X axis denotes the sibling feeling during dental treatment and Y axis denotes the number of patients. Most of the patient's siblings liked (red) the dental treatment (55%).
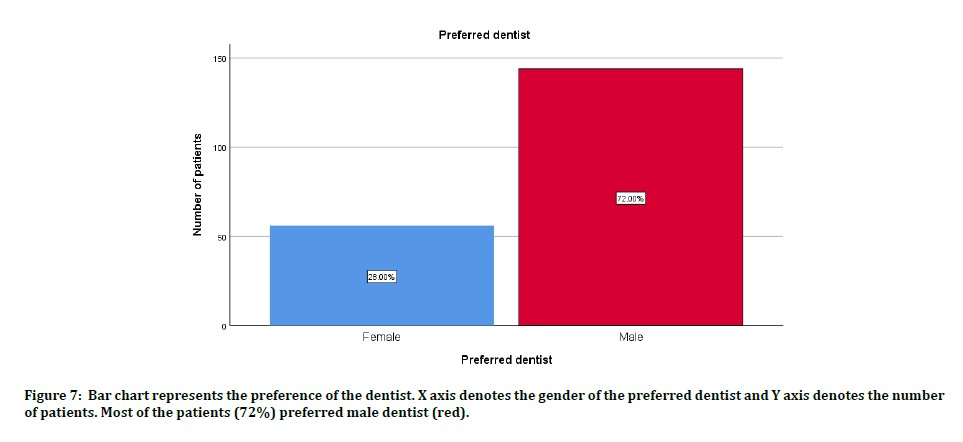
Figure 7: Bar chart represents the preference of the dentist. X axis denotes the gender of the preferred dentist and Y axis denotes the number of patients. Most of the patients (72%) preferred male dentist (red).
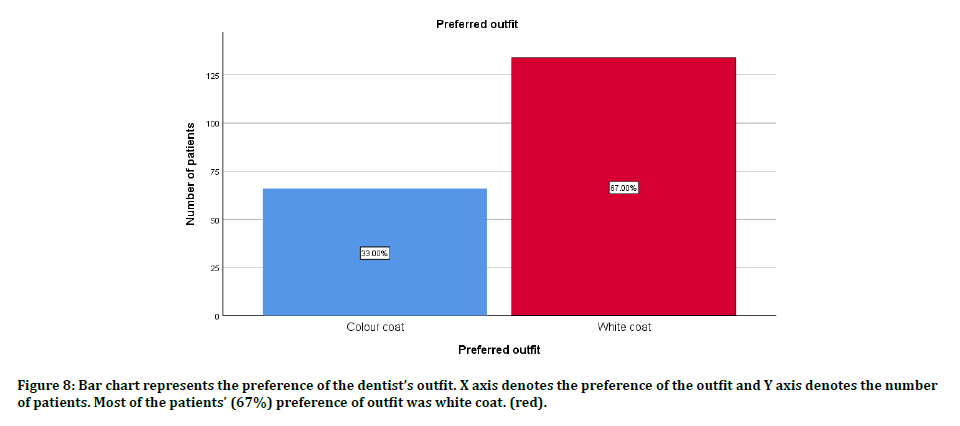
Figure 8: Bar chart represents the preference of the dentist’s outfit. X axis denotes the preference of the outfit and Y axis denotes the number of patients. Most of the patients' (67%) preference of outfit was white coat. (red).
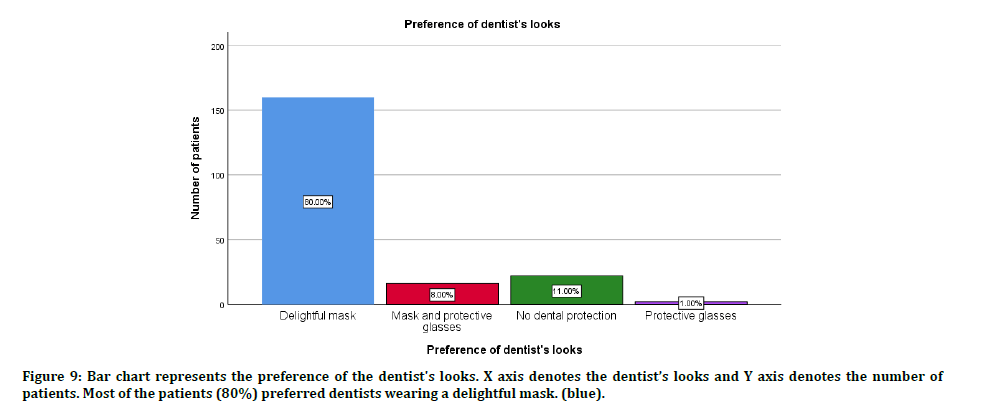
Figure 9: Bar chart represents the preference of the dentist's looks. X axis denotes the dentist’s looks and Y axis denotes the number of patients. Most of the patients (80%) preferred dentists wearing a delightful mask. (blue).
Association between gender and previous dental experience was done and it was found that among the females 30.6% liked their previous experience and 21.4% did not and among the males 24.4% had a positive response about their previous dental experience and 23.4% did not have a positive experience. Chi square test was done, and it was found that there was no significant association between gender and previous dental experience (p=0.440) (Figure 10).
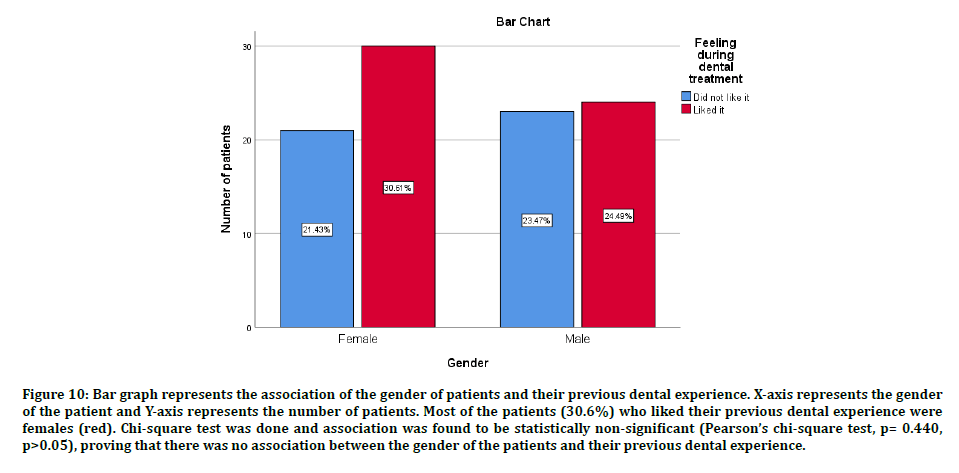
Figure 10: Bar graph represents the association of the gender of patients and their previous dental experience. X-axis represents the gender of the patient and Y-axis represents the number of patients. Most of the patients (30.6%) who liked their previous dental experience were females (red). Chi-square test was done and association was found to be statistically non-significant (Pearson’s chi-square test, p= 0.440, p>0.05), proving that there was no association between the gender of the patients and their previous dental experience.
Association between gender and preference of the dentist was done and it was found that among both males (42.5%) and female (29.5%) patients preferred a male dentist and 20% of the female patients and 8% of male patients preferred a female dentist. Chi square test was done, and it was found that there was a significant association between the gender and preference of the dentist (p=0.000) (Figure 11).
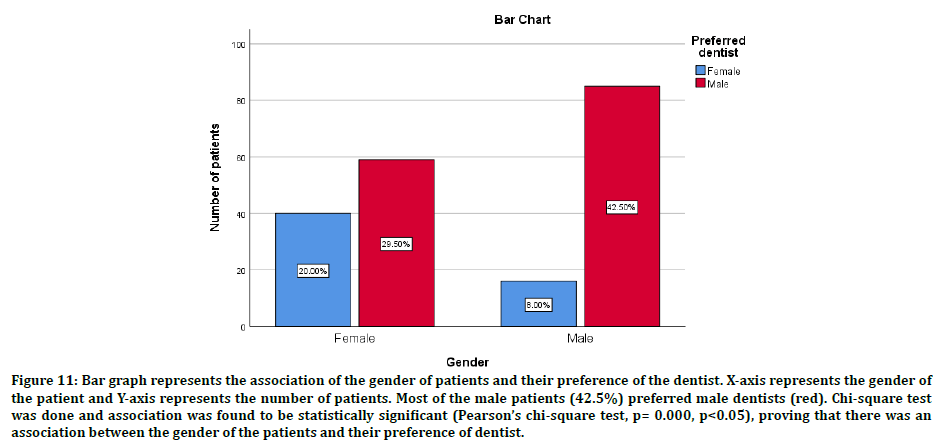
Figure 11: Bar graph represents the association of the gender of patients and their preference of the dentist. X-axis represents the gender of the patient and Y-axis represents the number of patients. Most of the male patients (42.5%) preferred male dentists (red). Chi-square test was done and association was found to be statistically significant (Pearson’s chi-square test, p= 0.000, p<0.05), proving that there was an association between the gender of the patients and their preference of dentist.
Association between gender and preference of the dentist’s outfit was done and it was found that among the female patients, 25.5% preferred colour coat and 24% preferred white coat and most of the male patients preferred white coat (43%) followed by colour coat. Chi square test was done, and it was found that there was a significant association between the gender and preference of the dentist’s outfit. (p=0.000) (Figure 12).
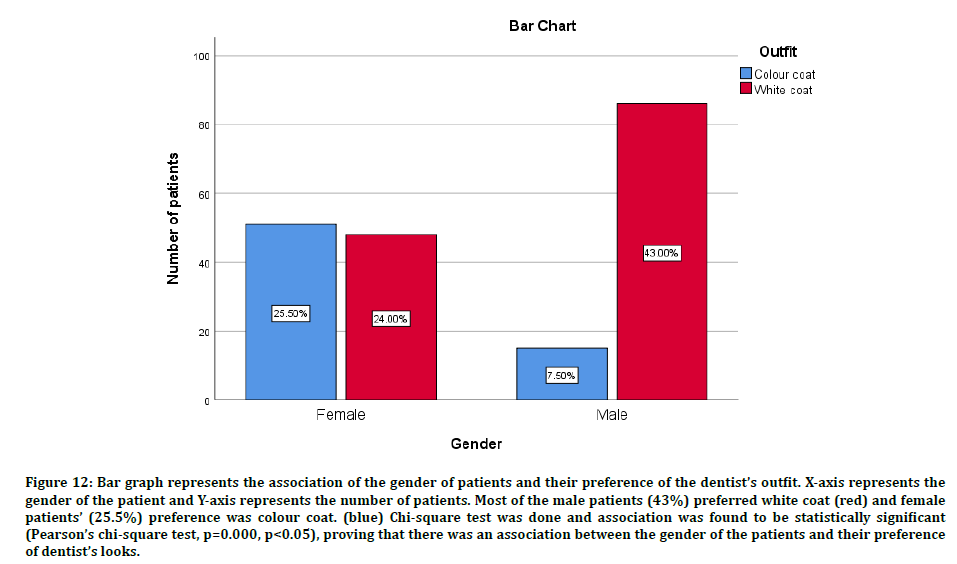
Figure 12: Bar graph represents the association of the gender of patients and their preference of the dentist’s outfit. X-axis represents the gender of the patient and Y-axis represents the number of patients. Most of the male patients (43%) preferred white coat (red) and female patients’ (25.5%) preference was colour coat. (blue) Chi-square test was done and association was found to be statistically significant (Pearson’s chi-square test, p=0.000, p<0.05), proving that there was an association between the gender of the patients and their preference of dentist’s looks.
In our study we found out that most of the patients did not have a previous dental experience and among the patients who had visited a dentist before, most of them liked their experience. It was also found that most of the patients did not have a physician in the family. Most of the patients’ siblings liked their previous dental experience. Male dentists, white coats and delightful masks were the most common preferences of the patients.
The majority of the patients in this study reported that they liked their first visit to the dentist in which most were female patients which is consistent with the results Sharma et al. [30] Mittal and Sharma indicated that male patients had more negative perceptions than the female patients.
In our study, most of the patients preferred to be treated by a male dentist, regardless of the child’s gender. Mistry et al reported a significant difference in the preference of the participants for the gender of their dental health care provider: male participants favored male students and females preferred female students [31].
In our study most of the male patients preferred white coats and most of the female patients preferred colour coats. Al Sarheed et al. indicated that children prefer their dentist to wear the traditional formal attire with a white coat as they see it as a symbol of healing [9]. This finding supports the report by McCarthy et al who found that children are not afraid of a physician in a white coat [32]. Münevveroğlu et al. 76.5% of the children preferred their dentist to wear a colored coat instead of white one [33]. Physical appearance is a factor in a person’s choice and plays an important role in the development of the physician-patient relationship.
Proper dress and the use of protective clothing protect both patients and health care providers from infectious diseases. In our study, most of the patients preferred dentists wearing delightful masks. Similarly, Shulmam et al. [34] reported that 70% preferred that dentists wore delightful masks during dental treatment that made the children concentrate on the masks which ultimately aid in the dental anxiety of the kid.
Conclusion
Within the limits of the study, it was found that the majority of the patients liked their first visit to the dentist in which most were female patients and there was no statistically significant association. Most of the patients preferred to be treated by a male dentist, regardless of the child’s gender and a statistically significant association was seen. Most of the male patients preferred white coats and most of the female patients preferred colour coats and a statistically significant association was seen.
Authors Contributions
First author (Keerthana R) performed the analysis, and interpretation and wrote the manuscript. Second author (Dr. Ganesh Jeevanadan) contributed to conception, data design, analysis, interpretation and critically revised the manuscript. Both the authors have discussed the results and contributed to the final manuscript.
References
- Taani DQ, El-Qaderi SS, Alhaija EA. Dental anxiety in children and its relationship to dental caries and gingival condition. Int J Dent Hygiene 2005; 3:83–87.
- Gustafsson A, Arnrup K, Broberg AG, et al. Psychosocial concomitants to dental fear and behaviour management problems. Int J Paediatr Dent 2007; 17:449–459.
- Corah NL, Gale EN, Illig SJ. The use of relaxation and distraction to reduce psychological stress during dental procedures. J Am Dent Assoc 1979; 98:390–394.
- Kleinknecht RA, Klepac RK, Alexander LD. Origins and characteristics of fear of dentistry. J Am Dent Assoc 1973; 86:842–848.
- Berscheid E, Gangestad S. The social psychological implications of facial physical attractiveness. Clin Plastic Surg 1982; 9:289–296.
- https://oxford.universitypressscholarship.com/view/10.1093/oso/9780198803409.001.0001/oso-9780198803409-chapter-4
- Brandt LJ. On the Value of an old dress code in the new millennium. Archives Int Med 2003; 163:1277.
- Lill MM, Wilkinson TJ. Judging a book by its cover: Descriptive survey of patients’ preferences for doctors' appearance and mode of address. BMJ 2005; 331:1524–1527.
- AlSarheed M. Children’s perception of their dentists. Europ J Dent 2011; 05:186–190.
- Alvesalo I, Murtomaa H, Milgrom P, et al. The dental fear survey schedule: A study with Finnish children. Int J Paediatr Dent 2009; 3:193–198.
- Ravikumar D, Ramakrishna M, Sharna N, et al. Evaluation of McNamara’s analysis in South Indian (Tamil Nadu) children between 8-12 years of age using lateral cephalograms. J Oral Biol Craniofac Res 2019; 9:193–197.
- Ravikumar D, Gurunathan D, Gayathri R, et al. DNA profiling of Streptococcus mutans in children with and without black tooth stains: A polymerase chain reaction analysis. Dent Res J 2018; 15:334.
- Ravikumar D, Jeevanandan G, Subramanian EMG. Evaluation of knowledge among general dentists in treatment of traumatic injuries in primary teeth: A cross-sectional questionnaire study. Eur J Dent 2017; 11:232–237.
- Ravindra V, Rekha V, Annamalai S, et al. A comparative evaluation between dermatoglyphic patterns and different terminal planes in primary dentition. J Clin Exp Dent 2018; 10:e1149–54.
- Ravindra V, Rekha CV, Annamalai S, et al. A comparative evaluation between cheiloscopic patterns and the permanent molar relationships to predict the future malocclusions. J Clin Exp Dent 2019; 11:e553–557.
- Govindaraju L, Jeevanandan G, Subramanian EMG. Comparison of quality of obturation and instrumentation time using hand files and two rotary file systems in primary molars: A single-blinded randomized controlled trial. Eur J Dent 2017; 11:376–379.
- Govindaraju L, Jeevanandan G, Subramanian EMG. Knowledge and practice of rotary instrumentation in primary teeth among Indian dentists: A questionnaire survey. J Int Oral Health 2017; 9:45.
- Nair M, Jeevanandan G, Vignesh R, et al. Comparative evaluation of post-operative pain after pulpectomy with k-files, kedos files and mtwo files in deciduous molars: A randomized clinical trial. Brazilian Dent Sci 2018; 21:411.
- Jeevanandan G, Ganesh S, Arthilakshmi. Kedo file system for root canal preparation in primary teeth. Indian J Dent Res 2019; 30:622–624.
- Panchal V, Jeevanandan G, Subramanian E. Comparison of instrumentation time and obturation quality between hand K-file, H-files, and rotary Kedo-S in root canal treatment of primary teeth: A randomized controlled trial. J Indian Soc Pedod Prev Dent 2019; 37:75–79.
- Subramanyam D, Gurunathan D, Gaayathri R, et al. Comparative evaluation of salivary malondialdehyde levels as a marker of lipid peroxidation in early childhood caries. Eur J Dent 2018; 12:67–70.
- Vignesh R, Sharmin D, Rekha CV, et al. Management of complicated crown-root fracture by extra-oral fragment reattachment and intentional reimplantation with 2 years review. Contemp Clin Dent 2019; 10:397–401.
- Ramadurai N, Gurunathan D, Samuel AV, et al. Effectiveness of 2% Articaine as an anesthetic agent in children: Randomized controlled trial. Clin Oral Investig 2019; 23:3543–3550.
- Panchal V, Gurunathan D, Shanmugaavel AK. Smartphone application as an aid in determination of caries risk and prevention: A pilot study. Eur J Dent 2017; 11:469–474.
- Panchal V, Jeevanandan G, Subramanian EMG. Comparison of post-operative pain after root canal instrumentation with hand K-files, H-files and rotary Kedo-S files in primary teeth: A randomised clinical trial. Eur Arch Paediatr Dent 2019; 20:467–472.
- Jeevanandan G, Govindaraju L. Clinical comparison of Kedo-S paediatric rotary files vs manual instrumentation for root canal preparation in primary molars: a double blinded randomised clinical trial. Eur Arch Paediatr Dent 2018; 19:273–278.
- Samuel SR, Acharya S, Rao JC. School interventions-based Prevention of early-childhood caries among 3-5-year-old children from very low socioeconomic status: Two-year randomized trial. J Public Health Dent 2020; 80:51–60.
- Ramakrishnan M, Dhanalakshmi R, Subramanian EMG. Survival rate of different fixed posterior space maintainers used in pediatric dentistry-A systematic review. Saudi Dent J 2019; 31:165–172.
- Vishnu Prasad S, Kumar M, Ramakrishnan M, et al. Report on oral health status and treatment needs of 5-15 years old children with sensory deficits in Chennai, India. Spec Care Dentist 2018; 38:58–59.
- Sharma M, Mittal R. Assessment of psychological effects of dental treatment on children. Contemporary Clinical Dentistry 2012; 3:2.
- Mistry D, Tahmassebi JF. Children’s and parents’ attitudes towards dentists’ attire. Europ Archives Paediatr Dent 2009; 10:237–240.
- McCarthy JJ, Christine McCarthy M, Eilert RE. Children’s and parents' visual perception of physicians. Clin Pediatr 1999; 38:145–152.
- Münevveroğlu AP, Akgöl BB, Erol T. Assessment of the feelings and attitudes of children towards their dentist and their association with oral health. ISRN Dent 2014; 2014:1–4.
- Shulman ER, Brehm WT. Dental clinical attire and infection-control procedures. J Am Dent Assoc 2001; 132:508–16.
Author Info
Keerthana R and Ganesh Jeevanadan*
Department of Pediatric Dentistry, Saveetha Dental College and Hospitals, Saveetha Institute of Medical and Technical Sciences, Saveetha University, Chennai, IndiaCitation: Keerthana R, Ganesh Jeevanadan, Assessment of the Feelings and Attitude of the Children Towards the Dentist, J Res Med Dent Sci, 2020, 8 (7): 84-92.
Received: 15-Sep-2020 Accepted: 15-Oct-2020 Published: 22-Oct-2020
