Research - (2021) Volume 9, Issue 7
Relationship of DMFT and Glomerular Filtration Rate in Adults Residing in Shahedieh city, Yazd Province
Abdolrahim Davari, Alireza Daneshkazemi, Sanaz Abbasi* and Farzad Ziaei
*Correspondence: Sanaz Abbasi, Department of Operative and Aesthetic Dentistry, Shahid Sadoughi University of Medical Sciences, Iran, Email:
Abstract
Background and Objectives: Oral health is a strong predictor of general health and the quality of life. Of all systemic diseases, renal disease is the most important cause of morbidity and mortality. Kidneys are among the critical organs for general health. Chronic kidney disease (CKD) occurs following progressive and irreversible destruction of nephrons, which is associated with decreased glomerular filtration rate (GFR), and increased serum Creatinine and blood urea nitrogen (BUN). Studies regarding the oral health status and prevalence of caries in patients with CKD are limited and controversial. Thus, this study aimed to assess the correlation of DMFT and GFR in adults residing in Shahedieh city. Materials and Methods: Information for this study was collected from the Yazd Shahedieh Project conducted on 9000 people. The serum Creatinine level, and age, gender and weight of patients were extracted from the questionnaire designed for the Yazd Shahedieh Project after obtaining a permit. The GFR of each individual was calculated using the Cockcroft Gault formula. For assessment of oral health status, the DMF index of permanent teeth of adults was calculated. The total number of decayed (D) (dental caries with/without restoration), missing (M) and filled (F) teeth (temporary or permanent filling, or partial filling without caries) was recorded as the DMF index. Data were coded and analyzed using SPSS version 23 via descriptive statistics, t-test, ANOVA, Pearson’s correlation coefficient, and regression analysis. Results: The correlation test showed that weight had no significant correlation with the number of carious teeth (D) but was significantly correlated with the number of filled teeth (F). Also, weight had an inverse correlation with the number of missing (M) teeth and DMFT. Serum Creatinine had no significant correlation with the number of decayed teeth (D) but had a direct correlation with the number of missing teeth (M) and DMFT. Serum Creatinine had an inverse correlation with the number of filled teeth (F). Age had an inverse correlation with the number of decayed (D) and filled (F) teeth but had a direct correlation with the number of missing (M) teeth and DMFT. GFR had a direct correlation with the number of decayed (D) and filled (F) teeth but had an inverse correlation with the number of missing (M) teeth and DMFT. The regression analysis showed that GFR had a significant inverse correlation with DMFT. Conclusion: DMFT had a significant inverse correlation with GFR, and a significant direct correlation with serum Creatinine. Patients with lower GFR and higher serum Creatinine (indicative of higher stage of CKD), had higher DMFT index.
Keywords
DMFT, Chronic kidney disease, Glomerular filtration rate
Introduction
Oral health is a strong predictor of general health and the quality of life according to the World Health Organization [1]. Of all systemic diseases worldwide, renal disorders are among the most important causes of morbidity and mortality since kidneys are critical for systemic health [2]. Kidneys play an important role in homeostasis by excretion of metabolic waste products, electrolytes and water [3]. Chronic kidney disease (CKD) is a common condition affecting 2-3% of the World’s population. According to the available statistics, over 7000 people in Iran are suffering from CKD [4]. CKD occurs due to progressive and irreversible destruction of nephrons, which is associated with decreased glomerular filtration rate (GFR), and increased serum Creatinine and blood urea nitrogen (BUN). Diabetes mellitus, glomerulonephritis, and chronic hypertension are among the most common causes of CKD [2,5,6].
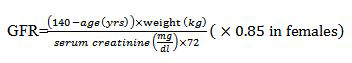
GFR is a clinical parameter for the volume of blood filtered by a glomerule per minute. It is extensively used for the measurement of renal function in health and disease conditions. GFR is normally 100-130 mL/min [7]. GFR can be calculated by different methods. However, using the Cockcroft Gault formula is the most common method, which calculates the GFR based on four parameters of serum Creatinine, age, gender, and weight [8].
Depending on the degree of renal insufficiency, CKD can be categorized into the stages shown in Table 1.
Table 1: Stages of CKD.
| CKD stage | Definition | GFR (mL per minute per 1.73 m2) |
|---|---|---|
| 1 | Kidney damage along with increased or normal GFR | ≥90 |
| 2 | Kidney damage along with a slight reduction in GFR | 60-89 |
| 3a | Mild to moderate reduction in GFR | 44-59 |
| 3b | Moderate to severe reduction in GFR | 30-43 |
| 4 | Severe reduction in GFR | 15-29 |
| 5 | Kidney failure | ˂15 |
CKD is a slowly progressive process, and no evidence of kidney damage or clinical symptoms are observed in stages 1 and 2. However, patients in stages 3 and 4 show some symptoms of renal damage and problems in other body organs. Patients in stage 5 often develop uremia and require kidney transplantation or dialysis [8].
CKD has several systemic and oral manifestations (in the hard and soft tissues). Oral manifestations depend on the age of patient and duration of disease and include mucosal ulcers, dental anomalies, altered composition of the saliva, xerostomia, oral infections, bony lesions, gingivitis, malocclusion, and increased risk of dental erosion [3,6,9].
Dental caries refers to progressive destruction of the tooth structure by the acids produced by the cariogenic bacteria. Dental caries is the most common chronic oral disease and the primary cause of tooth loss in adults, affecting almost all individuals [10].
The available information regarding the oral health status and particularly the prevalence of dental caries in CKD patients is limited and controversial. Some studies have reported lower caries prevalence in CKD patients compared with healthy controls [7-9,11,12]. Lower rate of caries in CKD patients has been attributed to the properties of the saliva and neutralization of the bacterial plaque products following an increase in pH due to the hydrolysis of urea. On the contrary, some others did not find a significant difference in the prevalence of caries between renal patients and healthy controls [13], and some other studies reported deterioration of oral health status and higher prevalence of caries in CKD patients compared with healthy individuals [2,14,15]. Thus, no consensus has been reached regarding the prevalence of caries in CKD patients, and to the best of the authors’ knowledge, there is only one study on the prevalence of caries in CKD patients at different stages of the disease so far [8].
Considering the increasing global prevalence of CKD and presence of a mutual relationship between oral infections and systemic health, as well as the significance of adequate knowledge of dental clinicians about oral healthcare in CKD patients, this study aimed to assess the correlation of DMFT and GFR in adults residing in Shahedieh city.
Materials and Methods
In this descriptive, analytical study, data were collected from the Yazd Shahedieh Research Project. After approving the study protocol and proposal by the Research Committee of Yazd Shahid Sadoughi University of Medical Sciences, ethical approval was obtained from the ethics committee of this university. Next, the variables related to the GFR including the serum Creatinine level, and age, gender, and weight of individuals as well as their DMFT index were extracted from the related questionnaire. The GFR of each individual was then calculated using the Cockcroft Gault formula as follows:
The oral and dental health status of individuals (pages 138 and 139 of the Shahedieh Project implementation protocol) was evaluated by examination and recording of the oral and dental health status according to the DMFT index for permanent teeth in adults. For this purpose, the total number of decayed (D) (presence of caries alone or in combination with restoration), missing (M), and filled (F) teeth (temporary or permanent filling) was calculated and reported as the DMF index. Considering the number of permanent teeth, the DMF index for each individual ranged from 0 to 32. Impacted teeth, congenitally missing teeth, and supernumeraries were not included for the DMFT assessment.
Inclusion criteria
Age ≥ 30 years and having completely filled questionnaires.
Exclusion criterion
Incomplete questionnaires.
After data collection, they were coded and analyzed using SPSS version 23 via descriptive statistics, t-test, ANOVA, Pearson’s correlation test, and regression analysis.
Results
This descriptive analytical study evaluated the correlation of DMFT and GFR in adults residing in Shahedieh city in Yazd Province in 2016. A total of 9,519 individuals were evaluated including 4,757 males and 4,762 females. Table 2 presents the measures of central dispersion for DMFT. As shown in Table 2, the mean number of decayed, missing and filled teeth was 2.14, 14.48, and 3.98, respectively with a mean DMFT index of 20.59. The minimum and maximum DMFT scores were 0 and 32, respectively.
Table 2: Measures of central dispersion for DMFT.
| Parameter | Number | Minimum | Maximum | Mean | Std. deviation |
|---|---|---|---|---|---|
| Decayed teeth (D) | 9519 | 0 | 26 | 2.14 | 3.3 |
| Missing teeth (M) | 9524 | 0 | 32 | 14.48 | 11.3 |
| Filled teeth (F) | 9520 | 0 | 24 | 3.98 | 4.67 |
| DMFT | 9519 | 0 | 32 | 20.59 | 8.88 |
Table 3 presents the frequency of CKD stages. ANOVA revealed a statistically significant different in DMFT between healthy individuals and those with different stages of CKD. The post-hoc test was then applied for pairwise comparisons of the groups which revealed the following:
Table 3: Frequency of CKD stages.
| Variable | Decayed teeth | Missing teeth | Filled teeth | DMF | ||||||||
|---|---|---|---|---|---|---|---|---|---|---|---|---|
| CKD stage | Number | Mean | Std. deviation | Number | Mean | Std. deviation | Number | Mean | Std. deviation | Number | Mean | Std. deviation |
| Normal | 1245 | 2.45 | 3.35 | 1245 | 8.18 | 8.18 | 1245 | 4.94 | 4.56 | 1245 | 16.2 | 7.72 |
| Stage 1 | 1038 | 2.26 | 3.13 | 1038 | 10.03 | 8.94 | 1038 | 5.21 | 4.78 | 1038 | 17.49 | 8.12 |
| Stage 2 | 5173 | 2.12 | 3.23 | 5174 | 14.13 | 11.05 | 5173 | 4.18 | 4.73 | 5173 | 20.41 | 8.71 |
| Stage 3a | 1616 | 1.94 | 3.5 | 1618 | 20.94 | 11.31 | 1617 | 2.3 | 3.93 | 1616 | 25.18 | 8.06 |
| Stage 3b | 272 | 1.78 | 3.83 | 273 | 25.89 | 9.65 | 272 | 0.78 | 2.54 | 272 | 28.43 | 6.73 |
| Stage 4 | 27 | 1.59 | 2.83 | 27 | 27.67 | 6.84 | 27 | 0.48 | 1.78 | 27 | 29/74 | 4.82 |
| Stage 5 | 4 | 3.75 | 4.11 | 5 | 18.6 | 11.3 | 4 | 1 | 1.41 | 4 | 27.5 | 3.41 |
| total | 9375 | 2.14 | 3.3 | 9380 | 14.53 | 11.32 | 9376 | 3.96 | 4.66 | 9375 | 20/62 | 8.89 |
| P value for ANOVA | P-value = 0.001 | P-value = 0.0001 | P-value = 0.0001 | P-value =0.0001 | ||||||||
Number of decayed teeth (D)
Significant differences only existed between normal individuals and those at stages 2, 3a and 3b CKD regarding the number of decayed (D) teeth. No other significant differences were noted in this respect.
Number of missing teeth (M)
Healthy individuals had significant differences with those at CKD stages 2, 3a, 3b and 4 in the number of missing (M) teeth. Also, stage 1 patients had significant differences with stages 2, 3a, 3b and 4 in this regard. Stage 2 patients had significant differences with stages 3a, 3b and 4, and stage 3a patients had a significant difference with 3b in this respect. No other significant differences were noted regarding the number of missing teeth (M).
Number of filled teeth (F)
Normal individuals had significant differences with those at CKD stages 2, 3a, 3b and 4 in the number of filled (F) teeth. Also, stage 1 patients had significant differences with stages 2, 3a, 3b and 4 in this regard. Stage 2 patients had significant differences with stages 3a, and 3b, and stage 3a patients had a significant difference with stage 3b in this respect. No other significant differences were noted regarding the number of filled teeth (F).
DMFT index
Healthy individuals had significant differences with those at CKD stages 1, 2, 3a, 3b and 4 in the DMFT index. Also, stage 1 patients had significant differences with stages 2, 3a, 3b and 4 in this regard. Stage 2 patients had significant differences with stages 3a, 3b, and 4, and stage 3a patients had a significant difference with stage 3b in this respect. No other significant differences were noted regarding the DMFT.
Table 4 presents the frequency of indices based on gender. As shown in Table 4, the difference in the number of decayed, missing and filled teeth and the DMFT was significant between males and females. Males had significantly higher number of decayed teeth while females had significantly higher number of missing and filled teeth and DMFT than males.
Table 4: Frequency of indices based on gender.
| Parameter | Gender | Number | Mean | Std. deviation | P-value |
|---|---|---|---|---|---|
| Number of decayed teeth | Male | 4757 | 2.47 | 3.73 | 0 |
| Female | 4762 | 1.81 | 2.78 | ||
| Number of missing teeth | Male | 4761 | 13.94 | 11.38 | 0 |
| Female | 4763 | 15.02 | 11.19 | ||
| Number of filled teeth | Male | 4758 | 3.64 | 4.46 | 0 |
| Female | 4762 | 4.32 | 4.84 | ||
| DMFT | Male | 4757 | 20.04 | 9.24 | 0 |
| Female | 4762 | 21.14 | 8.46 |
Table 5 presents the frequency of indices based on age. ANOVA demonstrated a significant correlation between DMFT indices and age; the difference in DMFT indices was significant among different age groups (P<0.05). The mean number of decayed teeth (D) in 45-54-year-olds (2.44), the mean number of filled teeth in 35-44-yearolds (6.12) and the mean number of missing teeth and DMFT in those over 65 years were significantly higher than other age groups.
Table 5: Frequency of indices based on age.
| Parameter | Age groups | Number | Mean | Std. deviation | ANOVA |
|---|---|---|---|---|---|
| Number of decayed teeth | 35-44 | 2497 | 2.14 | 2.98 | 0 |
| 45-54 | 3186 | 2.44 | 3.4 | ||
| 55-64 | 2499 | 2.13 | 3.47 | ||
| 65 and higher | 1337 | 1.43 | 3.2 | ||
| Total | 9519 | 2.14 | 3.3 | ||
| Number of missing teeth | 35-44 | 2497 | 6.57 | 6.15 | 0 |
| 45-54 | 3187 | 11.28 | 9.19 | ||
| 55.64 | 2501 | 20.03 | 10.8 | ||
| 65 and higher | 1339 | 26.49 | 8.76 | ||
| Total | 9524 | 14.48 | 11.3 | ||
| Number of filled teeth | 35-44 | 2497 | 6.12 | 4.75 | 0 |
| 45-54 | 3187 | 4.76 | 4.7 | ||
| 55.64 | 2499 | 2.56 | 4.09 | ||
| 65 and higher | 13.37 | 0.77 | 2.25 | ||
| Total | 9520 | 3.98 | 4.67 | ||
| DMFT | 35-44 | 2497 | 14.82 | 6.8 | 0 |
| 45-54 | 3186 | 18.49 | 8.04 | ||
| 55.64 | 2499 | 24.71 | 7.79 | ||
| 65 and higher | 1337 | 28.67 | 6.11 | ||
| Total | 9519 | 20.59 | 8.88 |
Table 6 presents the frequency of indices based on weight. ANOVA revealed significant correlations between weight and the number of missing and filled teeth and the DMFT index (P<0.05). However, weight had no significant correlation with the number of decayed teeth (P>0.05).
Table 6: Frequency of indices based on weight.
| Parameter | Weight | Number | Mean | Std. deviation | ANOVA |
|---|---|---|---|---|---|
| Number of decayed teeth | 30-39 | 11 | 2.73 | 3.97 | 0.09 |
| 40-49 | 148 | 2.26 | 3.81 | ||
| 50-59 | 806 | 2.26 | 3.81 | ||
| 60-69 | 2235 | 2.02 | 3.26 | ||
| 70-79 | 2828 | 2.09 | 3.27 | ||
| 80-89 | 2001 | 2.15 | 3.1 | ||
| 90-99 | 934 | 2.34 | 3.46 | ||
| 100 and higher | 475 | 2.42 | 3.22 | ||
| Total | 9438 | 2.14 | 3.31 | ||
| Number of missing teeth | 30-39 | 11 | 14.55 | 12.73 | 0.0001 |
| 40-49 | 148 | 19.24 | 11.87 | ||
| 50-59 | 807 | 17.21 | 11.82 | ||
| 60-69 | 2236 | 15.53 | 11.59 | ||
| 70-79 | 2831 | 14.8 | 11.37 | ||
| 80-89 | 2001 | 13.17 | 10.8 | ||
| 90-99 | 934 | 12.4 | 10.47 | ||
| 100 and higher | 475 | 11.05 | 9.5 | ||
| Total | 9443 | 14.48 | 11.29 | ||
| Number of filled teeth | 30-39 | 11 | 1.82 | 3.4 | 0.0001 |
| 40-49 | 148 | 2.97 | 4.09 | ||
| 50-59 | 806 | 3.24 | 4.51 | ||
| 60-69 | 2235 | 3.91 | 4.73 | ||
| 70-79 | 28.29 | 4.01 | 4.71 | ||
| 80-89 | 2001 | 4.3 | 4.65 | ||
| 90-99 | 934 | 4.13 | 4.61 | ||
| 100 and higher | 475 | 3.97 | 4.38 | ||
| Total | 9439 | 3.97 | 4.66 | ||
| DMF | 30-39 | 11 | 19.09 | 10.81 | 0.0001 |
| 40-49 | 148 | 24.47 | 8.01 | ||
| 50-59 | 806 | 22.68 | 8.83 | ||
| 60-69 | 2235 | 21.44 | 8.88 | ||
| 70-79 | 2828 | 20.9 | 8.78 | ||
| 80-89 | 2001 | 19.62 | 8.77 | ||
| 90-99 | 934 | 18.87 | 8.78 | ||
| 100 and higher | 475 | 17.43 | 8.39 | ||
| Total | 9438 | 20.58 | 8.88 |
Table 7 presents the frequency of indices based on serum Creatinine. As shown, the level of serum Creatinine had no significant correlation with the number of decayed, or missing teeth or the DMFT index in any of the normal or abnormal serum Creatinine groups. However, the level of serum Creatinine was significantly correlated with the number of restored teeth (P<0.05).
Table 7: Frequency of indices based on serum Creatinine.
| Parameter | Serum Creatinine level | Number | Mean | Std. deviation | P-value |
|---|---|---|---|---|---|
| Number of decayed teeth | Normal (≤ 1.2) | 6939 | 2.12 | 3.27 | 0.4 |
| Abnormal (>1.2) | 2588 | 2.18 | 3.4 | ||
| Number of missing teeth | Normal (≤ 1.2) | 6933 | 14.8 | 11.18 | 0.09 |
| Abnormal (>1.2) | 2591 | 14.36 | 11.6 | ||
| Number of filled teeth | Normal (≤ 1.2) | 6931 | 4.14 | 4.75 | 0.0001 |
| Abnormal (>1.2) | 2589 | 3.54 | 4.42 | ||
| DMFT | Normal (≤ 1.2) | 6931 | 20.61 | 8.73 | 0.67 |
| Abnormal (>1.2) | 2588 | 20.52 | 9.27 |
The Pearson’s correlation test was used to assess the correlation between the quantitative variables. Table 8 shows the Pearson’s correlation test results. As shown, weight had no significant correlation with the number of decayed teeth (D) but was significantly correlated with the number of filled (F) teeth. Also, weight had an inverse correlation with the number of missing (M) teeth and DMFT. Serum Creatinine had no significant correlation with the number of decayed (D) teeth but was correlated with the number of missing teeth (M) and DMFT. Also, serum Creatinine had an inverse correlation with the number of filled teeth (F).
Table 8: Pearson’s correlation test results.
| Parameter | Weight | Serum Creatinine | Age | GFR | |
|---|---|---|---|---|---|
| Number of decayed teeth | Pearson correlation | 0.01 | 0.01 | -.0.06 | 0.04 |
| P value | 0.09 | 0.09 | 0 | 0 | |
| Number of missing teeth | Pearson correlation | -0.14 | 0.04 | 0.63 | -0.34 |
| P value | 0 | 0 | 0 | 0 | |
| Number of filled teeth | Pearson correlation | 0.04 | -0.07 | -0.4 | 0.18 |
| P value | 0 | 0 | 0 | 0 | |
| DMFT | Pearson correlation | -0.15 | 0.03 | 0.56 | -0.32 |
| P value | 0 | 0.001 | 0 | 0 |
Age had an inverse correlation with the number of decayed (D) and filled (F) teeth but was directly correlated with the number of missing teeth (M) and DMFT.
GFR had a direct correlation with the number of decayed (D) and filled (F) teeth but was inversely correlated with the number of missing (M) teeth and DMFT.
Table 9 presents the results of regression analysis, which was applied to predict one variable based on another. The results showed that GFR had a significant inverse correlation with DMFT.
Table 9: Regression analysis.
| Model | Unstandardized coefficients | standardized coefficients | t | P value | |
|---|---|---|---|---|---|
| B | Std. Error | Beta | |||
| GFR | -0.121 | 0.004 | -0.32 | -32.946 | 0 |
DMF: Dependent variable
Discussion
Despite the advances in management of CKD patients and renal transplantation, the rate of morbidity and mortality is still high in CKD patients. These patients are more susceptible to infections than the general population. Infection is life-threatening in CKD patients and has a challenging management. On the other hand, dental caries is among the most common health problems worldwide, affecting almost all individuals. A carious tooth can lead to an abscess if left untreated, and the infection can spread to other parts of the body via the blood stream. Thus, dental examination by a skillful dentist is highly important in CKD patients for early detection and restoration of carious teeth [2].
This study aimed to assess the prevalence of decayed, missing and filled teeth and the DMFT index in patients at different stages of CKD based on their weight, age and gender. Also, the correlation of DMFT index with age, gender, weight and GFR was analyzed in Shahedieh city in Yazd Province.
Different stages of CKD
In this study, CKD patients at different stages of disease had significantly higher number of decayed, missing, and filled teeth and higher DMFT index than those with normal renal function (P<0.05). These results were different from the findings of Tadakamadla et al. They reported that CKD patients at different stages of disease had lower frequency of decayed and missing teeth and lower DMFT index than controls; although these differences were not statistically significant (P>0.05). This finding can be due to the breakdown of urea in the saliva to ammonia and carbon dioxide and subsequent increase in the pH of the oral cavity, preventing enamel demineralization [8]. Loscey et al, in their study with a 2- year follow-up reported higher rate of decayed and missing teeth in haemodialysis patients, which was in line with our findings and can be due to poorer oral hygiene and cryogenic diet with low protein and high carbohydrate in CKD patients [16].
The present study assessed the correlation of DMFT and GFR using the Pearson’s correlation test and showed a significant inverse correlation between DMFT and GFR and a significant direct correlation between DMFT and serum Creatinine. In other words, patients at higher stages of CKD with lower GFR and higher serum Creatinine had higher DMFT index.
Age
The Pearson’s correlation test showed a significant direct correlation between DMFT and age (P<0.05), which was different from the results of Namal et al, in Turkey since they reported a reduction in caries prevalence with age. On the other hand, our results in this respect were in agreement with those of Wang et al, in China since they demonstrated a significant increase in DMFT with age [17-19].
Gender
Gender had a significant correlation with DMFT indices such that males had a significantly higher number of decayed teeth compared with females. This finding was in contrast to the results of some studies that reported higher frequency of caries in females [1]. However, in line with our findings, some other studies reported significantly higher prevalence of caries in males [19-21]. In the present study, the number of missing and filled teeth and the DMFT index in females were significantly higher than the corresponding values in males. This finding can be attributed to superior oral hygiene in females and their greater attention to their oral health, seeking treatment (restoration or extraction) for their carious teeth.
Weight
Weight had a significant correlation with DMFT. Other studies calculated the BMI by dividing the weight in kilograms by height in square-meters. According to the World Health Organization, BMI ≥ 25 kg/m2 indicates overweight while BMI > 30 kg/m2 indicates obesity in adults. Sheiham et al, in their study conducted in the United Kingdom showed that individuals with ≤ 20 teeth were more likely to be overweight or obese (having higher BMI). They explained the reason to be the decreased bite force and tendency to consume soft foods by the obese individuals [22]. However, another study conducted on Korean adults reported contrary results and explained that this finding can be due to a diet with higher calcium, phosphorous and protein content, causing tooth remineralization [23].
Limitations of the Study
Dental caries is a multifactorial disease, and its development depends on several factors such as the tooth anatomy, saliva, pH, biofilm composition, diet, oral hygiene, immune system, genetic factors, etc. However, this study only assessed the correlation of DMFT and GFR with a cross-sectional design, without considering the role of other influential factors and without follow-up.
Conclusion
DMFT had a significant inverse correlation with GFR, and a significant direct correlation with serum Creatinine. Patients with lower GFR and higher serum Creatinine (indicative of higher stage of CKD), had higher DMFT index.
References
- Caglayan F, Altun O, Miloglu O, et al. Correlation between oral health-related quality of life (OHQoL) and oral disorders in a Turkish patient population. Med Oral Patholo 2009; 14:e573-8.
- Hamid MJ, Dummer CD, Pinto LS. Systemic conditions, oral findings and dental management of chronic renal failure patients: General considerations and case report. Br Dent J 2006; 17:166-70.
- Altamimi AG, AlBakr SA, Alanazi TA, et al. Prevalence of periodontitis in patients undergoing hemodialysis: A case control study. Materia Socio-Med 2018; 30:58-61.
- https://www.sid.ir/en/journal/ViewPaper.aspx?id=39733
- Anuradha BR, Katta S, Kode VS, et al. Oral and salivary changes in patients with chronic kidney disease: A clinical and biochemical study. J Indian Society Periodontol 2015; 19:297-301.
- Proctor R, Kumar N, Stein A, et al. Oral and dental aspects of chronic renal failure. J Dent Res 2005; 84:199-208.
- Dioguardi M, Caloro GA, Troiano G, et al. Oral manifestations in chronic uremia patients. Renal Failure 2016; 38:1-6.
- Tadakamadla J, Kumar S, Mamatha GP. Comparative evaluation of oral health status of chronic kidney disease (CKD) patients in various stages and healthy controls. Special Care Dent 2014; 34:122-6.
- Ertuğrul F, Elbek-Cubukçu C, Sabah E, et al. The oral health status of children undergoing hemodialysis treatment. Turkish J Pediatr 2003; 45:108-13.
- Abbass MMS, AbuBakr N, Radwan IA, et al. The potential impact of age, gender, body mass index, socioeconomic status and dietary habits on the prevalence of dental caries among Egyptian adults: A cross-sectional study. F1000 Res 2019; 8:243.
- Al-Nowaiser A, Roberts GJ, Trompeter RS, e al. Oral health in children with chronic renal failure. Pediatr Nephrol 2003; 18:39-45.
- Chuang SF, Sung JM, Kuo SC, et al. Oral and dental manifestations in diabetic and nondiabetic uremic patients receiving hemodialysis. Oral Surg Oral Med Oral Pathol Oral Radiol Endodont 2005; 99:689-95.
- Andrade MR, Antunes LA, Soares RM, et al. Lower dental caries prevalence associated to chronic kidney disease: a systematic review. Pediatr Nephrol 2014; 29:771-778.
- Klassen JT, Krasko BM. The dental health status of dialysis patients. J Canadian Dent Assoc 2002; 68:34-38.
- Souza CM, Braosi AP, Luczyszyn SM, et al. Oral health in Brazilian patients with chronic renal disease. Revista Med Chile 2008; 136:741-746.
- Löcsey L, Alberth M, Mauks G. Dental management of chronic haemodialysis patients. Int Urol Nephrol 1986; 18:211-3.
- Brennan DS, Spencer AJ. Changes in caries experience among Australian public dental patients between 1995/96 and 2001/02. Australian New Zealand J Public Health 2004; 28:542-548.
- Fukuda Y, Nakamura K, Takano T. Accumulation of health risk behaviours is associated with lower socioeconomic status and women's urban residence: A multilevel analysis in Japan. BMC Public Health 2005; 5:53.
- Wang HY, Petersen PE, Bian JY, et al. The second national survey of oral health status of children and adults in China. Int Dent J 2002; 52:283-90.
- Henriksen BM, Ambjørnsen E, Axéll T. Dental caries among the elderly in Norway. Acta Odont Scandinavica 2004; 62:75-81.
- Varenne B, Petersen PE, Ouattara S. Oral health status of children and adults in urban and rural areas of Burkina Faso, Africa. Int Dent J 2004; 54:83-9.
- Sheiham A, Steele JG, Marcenes W, et al. The relationship between oral health status and Body Mass Index among older people: A national survey of older people in Great Britain. Br Dent J 2002; 192:703-706.
- Song IS, Han K, Ryu JJ, et al. Obesity is inversely related to the risks of dental caries in Korean adults. Oral Dis 2017; 23:1080-1086.
Author Info
Abdolrahim Davari, Alireza Daneshkazemi, Sanaz Abbasi* and Farzad Ziaei
Department of Operative and Aesthetic Dentistry, Shahid Sadoughi University of Medical Sciences, Yazd, IranCitation: Abdolrahim Davari, Alireza Daneshkazemi, Sanaz Abbasi, Farzad Ziaei,Relationship of DMFT and Glomerular Filtration Rate in Adults Residing in Shahedieh city, Yazd Province, J Res Med Dent Sci, 2021, 9(7): 235-243
Received: 16-Mar-2021 Accepted: 13-Jul-2021