Research - (2021) Volume 9, Issue 7
Surface modification of CAD-CAM Machined Zirconia using the 60 µs, 700 µs Er.Cr: YSGG laser pulse duration
Fateima Sameir Muhammed* and Hussein Ali Jawad
*Correspondence: Fateima Sameir Muhammed, Institute of Laser for Postgraduate Studies, University of Baghdad, Iraq, Email:
Abstract
Background: CAD-CAM milled zirconia surface treatment, for improving the resin cement bonding, by using Er,Cr:YSGG laser. Materials and Methods: 112 sintered zirconia disc specimens (VITA YZ HT) were prepared. They are divided into 16 groups, each group of seven samples. Control group (L): un treated samples. Laser groups are depending on laser power, irradiation time, and pulse duration, include 15 groups: group (A): 20 s, 50 Hz, 60 µs. Group (B): 30 s, 50 Hz, 60 µs. Group (C): 40 s, 50 Hz, 60 µs. Group (D): 20 s, 50 Hz, 700 µs. And group (E): 30 s, 50 Hz, 700 µs, and fractional Er,Cr:YSGG laser groups: Group f/A: 20 s, 25 Hz, 60 µs. Group f/B: 30 s, 25 Hz, 60 µs. Group f/C: 40 s, 25 Hz. 60 µs. Group f/D: 30 s, 50 Hz. 60 µs. Group f/E: 40 s, 50 Hz. 60 µs. Group f/a: 20 s, 25 Hz, 700 µs. Group f/b: 30 s, 25 Hz, 700 µs. Group f/c: 40 s, 25 Hz, 700 µs. Group f/d: 30s, 50 Hz, 700 µs. Group f/e: 40s, 50 Hz, 700 µs. All laser group specimens were applied for the different powers (1, 1.50, 2, 2.50, 3, 3.50, 4) W. Luting cement was bonded to treated zirconia surfaces and light-cured for 40 s. All samples were examined for determining the means for each specimen pulse depths. Shear bond strength was measured using a universal testing machine. then an average surface roughness was examined by an atomic force microscope. The obtained shear bond strength and laser pulse depth values were statistically analyzed. The bond failure modes were also examined. Results: There was a clear increment in zirconia surface laser pulse depth for the created micro holes especially in group E (30 s, 700 µs, 3.5 W) specimen, measuring (8.2 µm), accompanied by an enhanced average surface roughness, reaching (14.5nm) for the same group specimen. While the untreated specimen had the least examined average surface roughness value (3.05nm). The fractional laser applied parameters specimens showed no evident microscopically effect. Conclusion: It was showed that the shear bond strength was related to the depth of laser pulse and to the average surface roughness. The Er,Cr:YSGG laser pulse duration for a specific number of pulse repetition per second, are both important parameters for enhancing zirconia ceramic surface.
Keywords
Er,Cr:YSGG laser, Shear bond strength, Laser pulse depth, Zirconia surface treatmentIntroduction
The most popular technology that had become the centre of choice in dental restorations is all-ceramic material [1]. One of the most frequently used all-ceramic core material for fixed dental restorations is yttrium-stabilizedtetragonal- zirconia-polycrystal (Y-TZP) [2]. The clinical long-term success of Y-TZP depends on the strength and durability of resin cement bond to ceramic substrates and teeth that will be integrating all system parts into a coherent structure for enhancing the bonding strength for ceramic dental restorations [3]. A strong cement-ceramic bond requires micromechanical interlocking and/or chemical bonding to ceramic restoration surface, which needs surface roughening procedure [4]. Polycrystalline structure, which lacks a glass matrix, makes zirconia ceramic more resistant to hydrofluoric acid etching [5]. Air-borne particle abrasion [6], sandblasting, grinding with diamond bur [7], zirconia primers, tribochemical silica coating have been applied for surface conditioning [8].
Airborne particle abrasion imposes a removal of a significant amount of material which could affect its clinical adaptation. Tribochemical silica-coating system has been criticized for possible subcritical crack propagation within zirconia thin restorations [9]. Lasers have been employed for different purposes in dentistry including tooth structure or restorative surface conditioning [10].
Studies showed that roughening can be performed on ceramic surfaces with lasers use [11], such as Nd: YAG [12], Er: YAG and CO2 [13], and [14], Er,Cr: YSGG [15], femtosecond [16], and Factional CO2 [17]. The current study aims to investigate the effect of surface roughness on the SBS for different powers of Er,Cr:YSGG laser.
Materials and Methods
In this experimental study, 112 discs were milled from zirconium oxide presintered blocks ( vita YZ HT zahnfabrik/Germany) Figure 1, then sintered in a special furnace (Oven600/V2, South Tyrol) at 1450 °C for 8 hours including cooling, following the manufacturer’s instructions. The final disc dimensions were: (9 mm in diameter, 2 mm in thickness) (Figure 2). The bonding surface of zirconia discs was then polished consecutively with 600, 800, 1000, and 1200 grit silicon carbide abrasive papers with water coolant to standardize all surfaces. All specimens were ultrasonically cleaned in distilled water and 7o% alcohol for 3 min. Then examined under an optical microscope (OM) for presence of crack or fissure, and substituted by other perfect samples when needed.
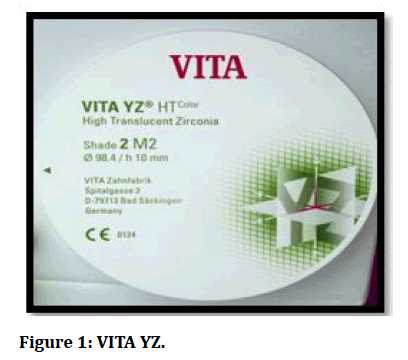
Figure 1: VITA YZ.
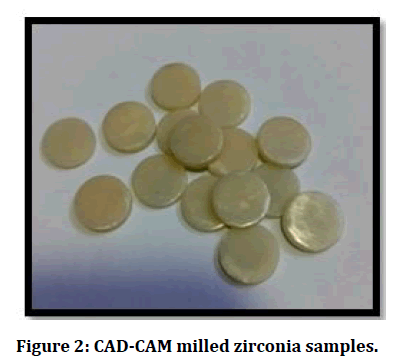
Figure 2: CAD-CAM milled zirconia samples.
Specimens grouping
112 zirconia discs were randomly divided into 16 groups, each with seven samples. group (L): Serve as the control group of untreated samples. Laser groups depends on the applied parameters. They are: Group (A): 20 s, 60 μs pulse duration, group (B): 30 s, 60 μs pulse duration, group (C): 40 s, 60 μs pulse duration, group (D): 20 s, 700 μs pulse duration, and group (E): 30 s, 700 μs pulse duration, for the different applied powers: (1, 1.5, 2, 2.5, 3, 3.5, 4) W.
Each zirconia disc bonding surface was irradiated with Er,Cr:YSGG laser λ= 2,780 nm (iPlus, Waterlase, Biolase Technologies Inc., Irvine, CA, USA) at HZ: 50, water/air level: 65/ 55%. 600 μm quartz core tip, held by hand, at 90º with sample horizontal surface, at a 1 mm distance from it [18]. The laser energy was delivered in a circular area of 6 mm diameter at the middle of each specimen. 70 zirconia specimens were prepared for the fractional laser study group to be irradiated with the provided fractional head of the Waterless I Plus Er,Cr:YSGG device. they were randomly divided into two main fractional groups: 60 μs pulse duration group, and 700 μs pulse duration group, each of (35) samples. Each sample was irradiated with seven different powers (1, 1.5, 2, 2.5, 3, 3.5, 4) W, for 50/10 % water/air level. The 60 μs groups are: Group f/A: 20 s, 25 Hz. Group f/B: 30 s, 25 Hz. Group f/C: 40 s, 25 Hz. Group f/D: 30 s, 50 Hz. Group f/E: 40 s, 50 Hz. The 700 μs groups are: Group f/a: 20 s, 25 Hz. Group f/b: 30 s, 25 Hz. Group f/c: 40 s, 25 Hz. Group f/d: 30s, 50 Hz. Group f/e: 40s, 50 Hz. Zirconia specimen was fixed in the teflon mold with the fractional laser head of (9 mm width, 2mm height) being adapted in contact with the polished zirconia surface, perpendicular to its horizontal plane. This was facilitated by the rectangular shape of the handpeice output opening, that allowed itself to be easily supported. All treated zirconia disc specimens were ultrasonicaly cleaned with alcohol and distilled water. Then examined under optical microscope (10X, 40X mag.) for laser effect inspection, and for determining the mean depth for the created micro holes for each specimen. Microscopical examination of fractional laser irradiated specimens showed no effect to be considered in this study. Each zirconia disc was horizontally embedded in an acrylic mold, as in Figure 3, facilitating for the resin cementation and bonding testing. Only 0.5 mm of the zirconia disc height was left to be exposed for the cementing procedure.
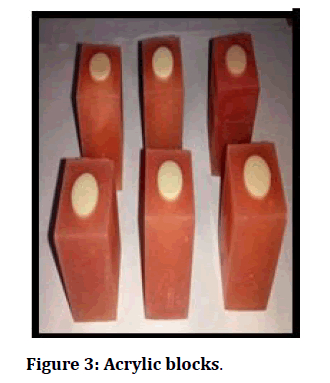
Figure 3: Acrylic blocks.
Silicon mold was used for letting the resin cement on zirconia surfaces, Figure 4. It was provided with a central circular opening of 5 mm diameter, and positioned over the acrylic mold ensuring that the circular opening being cantered over the zirconia disc. An adequate amount of adhesive cement (Rely X U200 self-adhesive resin cement, 3M ESPE, Germany) was auto mixed and delivered into the opening of the silicon mold. Then photo polymerized using a light cure device (Astralis5, Ivoclar Vivadent, Liechtenstein) for 40 s following manufacturer's instructions, as in Figure 5. And after one hour, specimens were stored in distilled water at 37°C for 24 hours before SBS test.
Figure 4: Silicon mold.
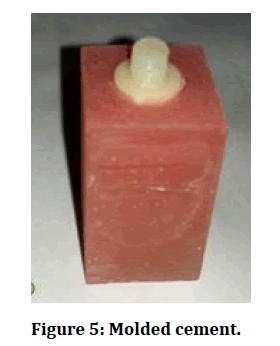
Figure 5: Molded cement.
The shear bond strength (SBS) was determined by subjecting samples to a shearing force at the zirconiacement interface in a universal testing machine (Instron, England), at 50% load for 1min/1mm, shown in Figure 6. The SBS values were evaluated in Mpa.
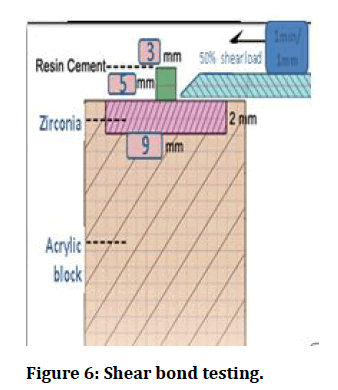
Figure 6: Shear bond testing.
Six samples: one as untreated sample, and five samples, from each laser group, that expressed the highest SBS values were examined for their average surface roughness (Ra), using an atomic force microscope (AFM).
All debonded samples were evaluated under a stereomicroscope (SM) at 40X magnification (ME, 2665, Euromex, Holland) for mode of failure evaluation. The modes of failure were classified as:
Adhesive: De-bonding only at the cement-ceramic interface.
Cohesive: A rupture in the cement or zirconia ceramic.
Mixed: shows both adhesive and cohesive failure modes.
Statistical analysis
This analysis was done with SPSS software version 23/ France. SBS and laser pulse depth (LPD) Data were analyzed by a one-way ANOVA-test (analysis of variance) to calculate the P-value between control and tested groups. LSD test was used to calculate the significant differences between tested means.
Results
Table 1 shows the mean and standard error values for SBS of the six groups (control and laser groups). The oneway analysis of variance (ANOVA) test indicated that there was a highly significant difference in SBS values among laser groups for the same power setting, mainly those treated with 4W. Whereas no significant differences were founded for the 1-2.5 W. Each laser group showed a highly significant difference compared to the control group.
Table 1: Shear bond strength measurements for different powers of Er,Cr:YSGG laser.
| Power/ | 20 sec/60 µ | 30 Sec / 60 µ | 40 Sec /60 µ | 20 Sec /700 µ | 30 Sec /700 µ | P value C VS G | P value L.G | |||||
|---|---|---|---|---|---|---|---|---|---|---|---|---|
| Shear bond | SBS Mean | Std. Error | SBS Mean | Std. Error | SBS Mean | Std. Error | SBS Mean | Std. Error | SBS Mean | Std. Error | ||
| 1W | C 5.24 | 0.2 | C 6.26 | 0.12 | C 5.94 | 0.41 | 6.84 | 0.33 | 5.79 | 0.91 | 0.01 | NS |
| 1.5W | C 5.30 | 0.13 | B 6.76 | 0.3 | C 5.44 | 0.1 | 6.8 | 0.68 | 6.49 | 0.43 | 0.01 | NS |
| 2 W | C 5.79 | 0.25 | C 6.44 | 0.3 | B 6.14 | 0.15 | 6.74 | 0 | 6.53 | 0.17 | 0.001 | NS |
| 2.5 W | C 5.86 | 0.42 | C 6.33 | 0.46 | B 6.24 | 0.03 | 6.51 | 0.33 | 6.59 | 0.11 | 0.001 | NS |
| 3 W | B 6.16 d | 0.03 | B 6.86 b | 0.37 | A 6.56 c | 0 | 6.91 b | 0.42 | 7.44 a | 0.54 | 0.0001 | 0.05 |
| 3.5 W | B 6.79 c | 0.05 | B 6.96 b | 0 | A 6.99 b | 0.2 | 7.05 b | 0.2 | 7.64 a | 0.02 | 0.0001 | 0.01 |
| 4 W | A 7.23 b | 0.14 | A 8.63 a | 0.13 | C 5.74 d | 0 | 6.94 b | 0.02 | 6.48 c | 0.19 | 0.0001 | 0.001 |
| CONTROL | 4.49 | 0.16 | 4.49 | 0.16 | 4.49 | 0.16 | 4.49 | 0.16 | 4.49 | 0.16 | ------ | ------- |
| *P value C VS L.G. | 0.0001 | 0.0001 | 0.0001 | 0.0001 | 0.0001 | |||||||
| P value L.G | 0.01 | 0.01 | 0.001 | NS | NS | |||||||
The LSD test of the same laser group, showed that the higher significant difference was for 3 and 3.5 W of group C expressed in (A), followed by group A 4 W expressed in (A). And least significant differences were detected with lower powers. All laser groups expressed highly significant differences when compared with the control group.
For the short pulse duration (60μs) groups, there was a clear increment in SBS with power increasing. Laser irradiation time increase (20s- 30s) yielded SBS increase for all applied powers. While laser irradiation time from the 30s- 40s had no increased effect on SBS values.
For the long pulse duration (700 μs) groups, the 700 μs pulse duration created no SBS enhancement for every power increasing. Laser irradiation time increase (20s-30s) yielded no enhancement for the SBS in return, except for powers (3, 3.5) W.
Comparing of the 60 μs, 700 μs pulse duration groups, all SBS values of the 700 μs pulse duration group specimens were higher than the 60 μs pulse duration groups, except for power 4W for both of the700 μs groups: D, E.
The SBS mean values of the 60 μs, 700 μs pulse duration groups are drawn as a function of power, and shown in Figure (7A) and Figure (7B) respectively. The general behavior of the five groups is the SBS increase with powe and number of irradiated pulses increasing. For the short pulse duration (60 μs), it was observed that the maximum SBS was obtained with 30 s, 60 μs, 4W laser parameters and the minimum SBS was obtained with 20 s, 60 μs, 1W laser parameters. For group A and B, the power increasing was accompanied by little SBS enhancements, except for 30 s, 4 W specimen, which witnessed a marked elevation in the SBS value. In group C, the 60 μs for 40 s laser irradiation time revealed that the threshold for the SBS increase was at the 3 W, and the maximum SBS value was reached at 4W, beyond which, no further gain in the SBS enhancement was observed.
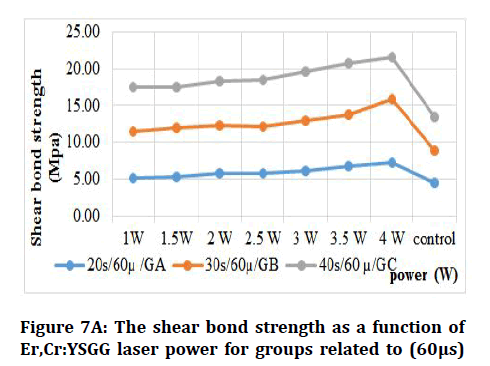
Figure 7A: The shear bond strength as a function of Er,Cr:YSGG laser power for groups related to (60μs) pulse duration (Group A/20s, 60μs. Group B/30s, 60μs. Group C/40s, 60μs).
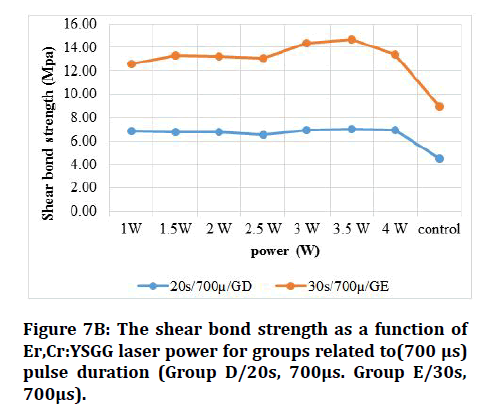
Figure 7B: The shear bond strength as a function of Er,Cr:YSGG laser power for groups related to(700 μs) pulse duration (Group D/20s, 700μs. Group E/30s, 700μs).
Figure 7A The shear bond strength as a function of Er,Cr:YSGG laser power for groups related to (60μs) pulse duration (Group A/20s, 60μs. Group B/30s, 60μs. Group C/40s, 60μs).
For the long pulse duration (700 μs), the maximum SBS was obtained with 30 s, 700 μs, 3.5W laser parameters and the minimum SBS was obtained with 20 s, 700 μs, 1W laser parameters. Laser irradiation for 20s, 700 μs had no effect on enhancing the SBS. The threshold for SBS increase, was at 30s, 3W, reaching its maximum value at 3.5 W. Nevertheless, the maximum reached SBS value for the 60 μs short pulse duration was higher than the 700 μs long pulse values.
The LPD mean values of the 60 μs, 700 μs pulse duration groups are drawn as a function of power, shown in Figure 8A and Figure 8B respectively.
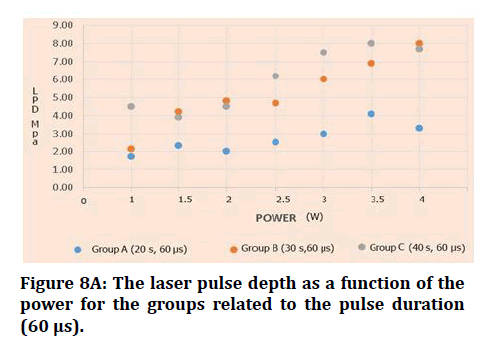
Figure 8A: The laser pulse depth as a function of the power for the groups related to the pulse duration (60 μs).

Figure 8B: The laser pulse depth as a function of power for groups related to the(700 μs) pulse duration.
The general behavior of the five groups is LPD increase with power and number of irradiated pulses increasing.
For the 60 μs pulse duration groups, the maximum laser pulse depth was obtained with group B 30 s, 60 μs, 4W laser parameters and the minimum laser pulse depth was obtained with group A 20 s, 60 μs, 1W laser parameters.
As for the 700 μs pulse duration groups, the maximum laser pulse depth was obtained with group E 30 s, 700 μs, 4W laser parameters and the minimum laser pulse depth was obtained with group D 20 s, 700 μs, 1W laser parameters. Both groups had their maximum LPD values at 4W. Power increasing for group D samples was unable to increase the LPD values.
Table 2 shows the mean and standard error values for LPD of the five laser groups. One-way ANOVA test indicated that, for different laser groups, the highest significant difference was for those specimens treated with 4W of groups B (30 s, 60 μs), and E (30 s, 700 μs), indicated by LSD test as (A) and the least significant difference was shown with 1W group A. For the same group, of different laser powers, the highest significant difference was for group B and E (4W) as; (A) Whereas, no significant difference in the LPD mean values was for the specimens treated with different laser powers of group D. Also the table clearly shows that, for the 700 μs groups, group E, 2W and above had higher LPD values than the 60 μs groups. Although, The 60 μs laser groups also showed a significant increase in the LPD values. All laser groups experienced an increase in the LPD with power and number of pulses increase.
Table 2: Laser pulse depths measurements for different powers of Er,Cr:YSGG laser.
| Power/Depth of laser | 20 sec/60 µ | 30 Sec / 60 µ | 40 Sec /60 µ | 20 Sec /700 µ | 30 Sec /700 µ | * P value | |||||
|---|---|---|---|---|---|---|---|---|---|---|---|
| Pulse depth Mean | Std. Error | Pulse depth Mean | Std. Error | Pulse depth Mean | Std. Error | Pulse depth Mean | Std. Error | Pulse depth Mean | Std. Error | ||
| 1W | D 1.70 c | 0.4 | E 2.10 b | 0.3 | F 4.50 a | 0.35 | 2.67 b | 0.69 | C 2.00 b | 0.2 | 0.05 |
| 1.5W | C 2.30 d | 0.21 | D 4.20 a | 0.15 | E 3.90 b | 0.1 | 3.40 c | 0 | C 2.30 d | 0.1 | 0.01 |
| 2 W | C 2.00 d | 0.15 | D 4.80 b | 0.56 | D 4.50 b | 0.12 | 3.70 c | 0.4 | B 6.20 a | 0.21 | 0.01 |
| 2.5 W | C 2.50 d | 0.12 | D 4.70 b | 0.53 | C 6.2 a | 0.72 | 3.50 c | 0.29 | B 6.30 a | 0.56 | 0.001 |
| 3 W | B 3.00 d | 0 | C 6.00 c | 0.23 | B 7.50 a | 0.2 | 3.50 d | 0.25 | B 6.50 b | 0.12 | 0.001 |
| 3.5 W | A 4.10 c | 0.51 | B 6.90 b | 0.06 | A 8.00 a | 0.58 | 3.30 d | 0.15 | A 7.90 a | 0.17 | 0.001 |
| 4 W | B 3.30 c | 0.65 | A 8.00 a | 0.21 | B 7.70 b | 0.35 | 3.70 c | 0.12 | A 8.20 a | 0.12 | 0.0001 |
| P value | 0.01 | 0.001 | 0.001 | NS | 0.001 | ||||||
AFM surface roughness analysis
The three-dimensional (3D) roughness measurements of different laser-treated specimens are shown in Figure 9. Specimen (30s, 700μs, 3.5W) showed the highest Ra (14.5nm) value. Whereas Specimen (30s, 60μs, 4W) showed decreased Ra value (8.88nm). the control group had the least Ra (3.05nm). Ra was increased with the increased laser power, increased number of pulses per sec., And with the longer pulse duration (700 μs) for all laser groups.
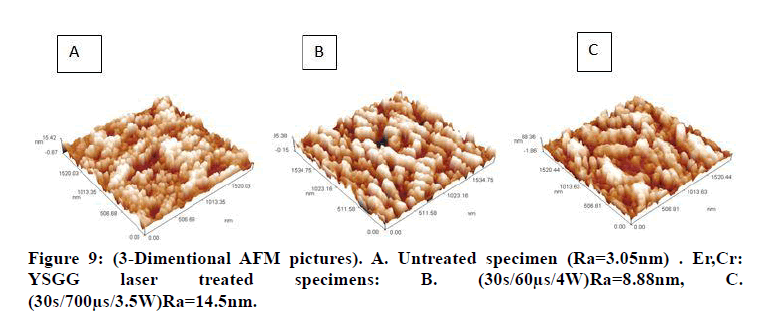
Figure 9: (3-Dimentional AFM pictures). A. Untreated specimen (Ra=3.05nm) . Er,Cr: YSGG laser treated specimens: B. (30s/60μs/4W)Ra=8.88nm, C. (30s/ 700μs/3.5W)Ra=14.5nm.
Table 3 demonstrate all six AFM examined samples expressing the highest SBS values, from each tested group.
Table 3: Average surface roughness values for one specimens of the highest SBS from each laser treated group.
| Experimental groups | Specimen for the applied power | Average surface roughness (nm) |
|---|---|---|
| Control group | 3.05 | |
| Group A (20sec.,60 µs) | 4 W | 7.73 |
| Group B (30sec., 60 µs) | 4 W | 8.88 |
| Group C (40sec.,60 µs) | 3.5 W | 10.2 |
| Group D(20sec.,700µs) | 3.5 W | 12.4 |
| Group E(30sec., 700µs) | 3.5 W | 14.5 |
Failure mode
The frequency of the failure modes after the SBS test for each group is shown in Table 4. The results indicated that the failure modes of the groups varied with the different laser parameters used. In group A, C type (1) failure mode was frequently observed in those specimens treated with 1-3 W for both groups. On the contrary, the failure mode of type 3 was mostly detected in group D, E except for (2, 2.50) W and (1, 1.50) W respectively. Type (2) had the least frequency in group B (4W) and E (3.5) W.
Table 4: Failure mode distribution.
| Groups | Adhesive Failure | Cohesive Failure | Mixed Failure | |||
|---|---|---|---|---|---|---|
| -1- | -2- | -3- | ||||
| No. | % | No. | % | No. | % | |
| A | 5 | 50 | 2 | 20 | ||
| B | 3 | 30 | 1 | 10 | 3 | 30 |
| C | 5 | 50 | 2 | 20 | ||
| D | 2 | 20 | 5 | 50 | ||
| E | 2 | 20 | 1 | 10 | 4 | 40 |
Discussion
The aim of the current study is the enhancement of SBS of resin cement to zirconia ceramic material, without laser optical damaging to zirconia surface such as cracks or fractures. Many laser studies attempted to investigate the effect of laser type, zirconia-surface temperature effect during irradiation, zirconia ceramic type and sintering condition, and resin cement type on the SBS, and found conflicting results. The laser pulses duration is important for laser material processing, so it’s effect should be studied. Laser predefined parameters are essential for obtaining a desired zirconia ceramic surface modification [13]. Surface roughness is crucial for increasing bonding strength values [19]. The obtained results showed that samples treated with Er,Cr:YSGG laser showed increased surface roughness as compared with untreated zirconia samples. Regarding the 60 μs groups, the higher SBS mean value was with Er,Cr:YSGG laser specimen: (8.63 Mpa), with Ra value: (8.88 nm) and LPD (8μ). While for the 700 μs groups, the higher SBS mean value was for a specimen: (7.64 Mpa) with Ra value: (14.5 nm) and LPD (8.2μ). The increased Ra and LPD values, for the 700 μs group, over the 60 μs groups, was not accompanied by SBS increasing as well. These findings were in good agreement with [17], who reported surface roughness increase with higher powers and long pulse duration. But it had no enhanced for the bond strength. Also, [20] concluded that, only 4 W CO2 laser irradiation for Y-TZP ceramics is recommended as an alternative surface treatment to sandblasting. These results disagreed with [21], who examined surface roughness on Y-TZP surface after Er:YAG laser treatment at (1.5 W/20 Hz), and concluded that laser had decreased the surface roughness. This could probably be due to the fact that the author had used low laser powers. The behavior of the long pulse in the zirconia roughening is of lateral laser-heat dissipation, contirbuting to morphological changes in zirconia structure beyond the LPD periphery, for the temperature elevation within the laser affected zone that the low powers capacity would not be effective, and the higher powers would lose their heat confinement, imposing a material damaging effect. The resultant pattern is increased LPD, and Ra values of a weakened resin-cement interlocking, as shown from the SBS results. The amount of pulses striking the irradiation zone per second, strongly affect the absorption and ablation process, as it determines the amount of ablated particles and therefore the created depth that elevate the SBS to an optimized enhancement. For the 60 μs group, the short pulse heat confinement encouraged for no power wasting. So increasing the time of laser irradiation from 20s to 30s had in turn increased the number of pulses by two times without needing an increased power. Gaining the ablation process much more energy per second of irradiation, needed for efficient LPD creation. So all of the micro holes had increased in depth, exposing larger surface areas for resin cement to flow and polymerize into rigid mechanical interlocking. The 30 s laser irradiation time for low powers (1, 1.5) W, had higher LPD values than the long pulse duration (700 μs) group. While for high powers (2 W) and above, the long pulse duration group had higher LPD values compared to short pulse groups. This could be explained as: the energy per pulse, of the 60 μs group for low power specimens, is of confined heat, creating well-defined depth with no loss of energy to area peripheral to LPD. Which was not the case for the 700 μs pulse duration. At higher powers, for the 700 μs groups, the zirconia surface would turn over-heated with repeated, high energy pulses, an effect, when combined with the heat dissipation, would create an increase in LPD values, over the 60 μs group.
Conclusion
The derived results had reached the following conclusions: The highest SBS of the Er:Cr:YSGG laserirradiated specimens are obtained with the laser parameters of the 30s, 60μs, 4W. Higher surface roughness values were with the increased number of pulses per second, and pulse duration time, for high powers. But it had no enhancement on the bonding strength. The pulse duration and power are both vital parameters in zirconia ceramic surface roughness, for enhancement of the bonding strength to the resin cement.
References
- Zarone F, Ferrari M, Mangano FG, et al. “Digitally oriented materials”: Focus on lithium disilicate ceramics. Int J Dent 2016; 2016.
- Cavalcanti AN, Foxton RM, Watson TF, et al. Y-TZP ceramics: Key concepts for clinical application. Operative Dent 2009; 34:344-51.
- Burke FJ, Fleming GJ, Nathanson D, et al. An assessment of the current evidence. J Adhesive Dent 2002; 4:7–22.
- Borges GA, Sophr AM, De Goes MF, et al. Effect of etching and airborne particle abrasion on the microstructure of different dental ceramics. J Prosthet Dent 2003; 89:479-88.
- Guazzato M, Quach L, Albakry M, et al. Influence of surface and heat treatments on the flexural strength of Y-TZP dental ceramic. J Dent 2005; 33:9-18.
- Kara HB, Ozturk AN, Aykent F, et al. The effect of different surface treatments on roughnessand bond strength in low fusing ceramics. Lasers Med Sci 2011; 26:599-604.
- Yoo JY, Yoon HI, Park JM, et al. Porcelain repair-Influence of different systems and surface treatments on resin bond strength. J Adv Prosthodont 2015; 7:343-8.
- Valandro LF, Özcan M, Amaral R, et al. Effect of testing methods on the bond strength of resin to zirconia-alumina ceramic: Microtensile versus shear test. Dent Materials J 2008; 27:849-55.
- Zhang Y, Sailer I, Lawn BR. Fatigue of dental ceramics. J Dent 2013; 41:1135-47.
- Fischer J, Grohmann P, Stawarczyk B. Effect of zirconia surface treatments on the shear strength of zirconia/veneering ceramic composites. Dent Materials J 2008; 27:448-54.
- Kimyai S, Oskoee SS, Mohammadi N, et al. Effect of different mechanical and chemical surface treatments on the repaired bond strength of an indirect composite resin. Lasers Med Sci 2015; 30:653-9.
- Kasraei S, Rezaei-Soufi L, Yarmohamadi E, et al. Effect of CO2 and Nd:YAG Laser on shear bond strength of resin cement to zerconia ceramic. J Dent Tehran Univercity of Medical Science 2015; 12:686-94.
- Kasraei S, Rezaei-Soufi L, Heidari B, et al. Bond strength of resin cement to CO2 and Er:YAG laser-treated zirconia ceramic. J Restorative Dent Endodont 2014; 39:296–302.
- Sofi LR, Fekrazad R, Akbarzadeh M, et al. Effect of Er: YAG laser, sandblast and several types of universal bonding onshear bond strength of zirconia ceramic to composite resin. J Contemporary Dent Practice 2018; 19:1246-1253.
- Yanardag EC, Yilmaz SK, Karakaya I, et al. Effect of different surface treatment methods on micro-shear bond strength of CAD-CAM restorative materials to resin cement. J Adhesion Sci Technol 2018; 33:110-123.
- Ünal SM, Nigiz R, Polat ZS, et al. Effect of ultrashort pulsed laser on bond strength of Y-TZP zirconia ceramic to tooth surfaces. Dent Materials J 2018; 34:351-357.
- Alhassani LI, Jawad HA. Influence of fractional CO2 laser irradiation on temperature elevation and bonding strength of resin cement to the zirconia ceramic. Iraqi J Laser 2017; 17:23-31.
- Kara R. The effect of Er,Cr: YSGG laser surface treatment on shear bond strength of resin cement to zirconia ceramic. J Dent Med Sci 2020; 19:38-42.
- Moon JE, Kim SH, Lee JB, et al. The effect of preparation order on the crystal structure of yttria-stabilized tetragonal zirconia polycrystal and the shear bond strength of dental resin cements. Dent Material 2011; 27:651–663.
- Kunt E. Effects of laser treatments on surface roughness of zirconium oxide ceramics. BMC Oral Health 2018; 18:222.
- Miranda PV, Rodrigues JA, Blay A, et al. Surface alterations of zirconia and titanium substrates after Er, Cr:YSGG irradiation. Lasers Med Sci 2018; 30:43–48.
Author Info
Fateima Sameir Muhammed* and Hussein Ali Jawad
Institute of Laser for Postgraduate Studies, University of Baghdad, Baghdad, IraqCitation: Fateima Sameir Muhammed, Hussein Ali Jawad, Surface modification of CAD-CAM Machined Zirconia using the 60 ?s, 700 ?s Er.Cr: YSGG laser pulse duration , J Res Med Dent Sci, 2021, 9(7): 244-250
Received: 23-May-2021 Accepted: 14-Jul-2021
